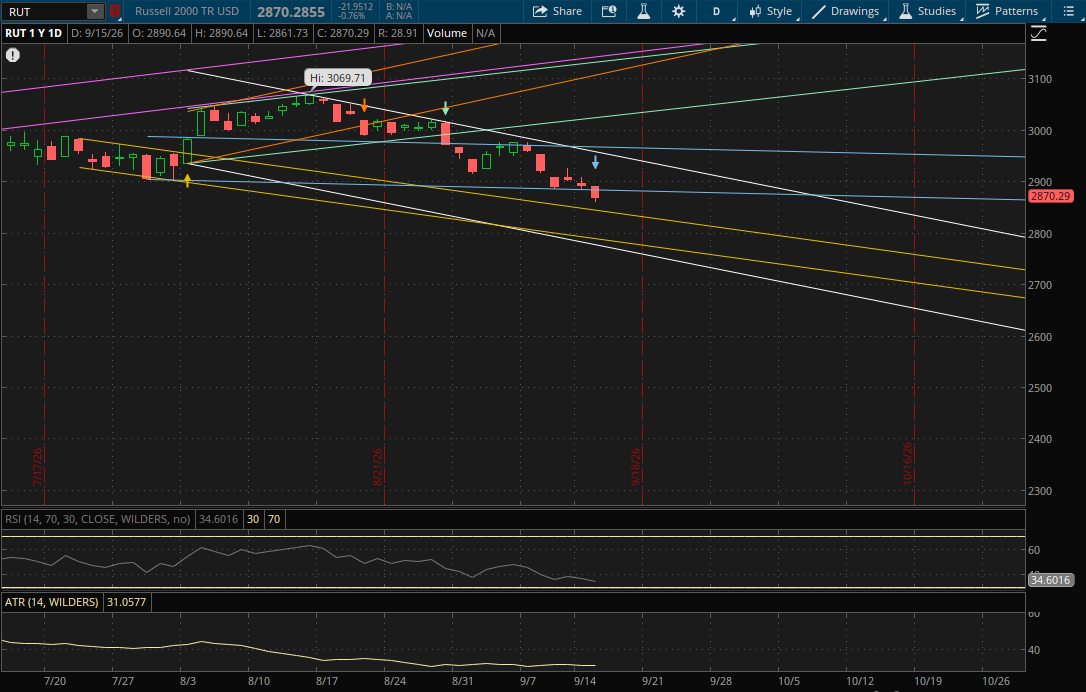
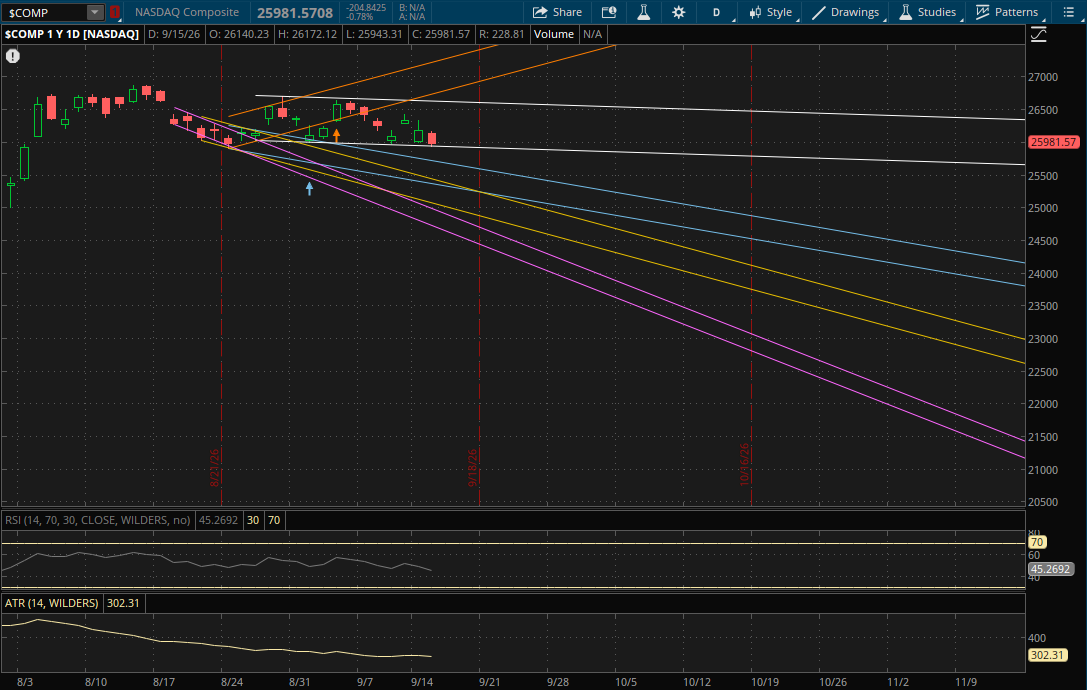
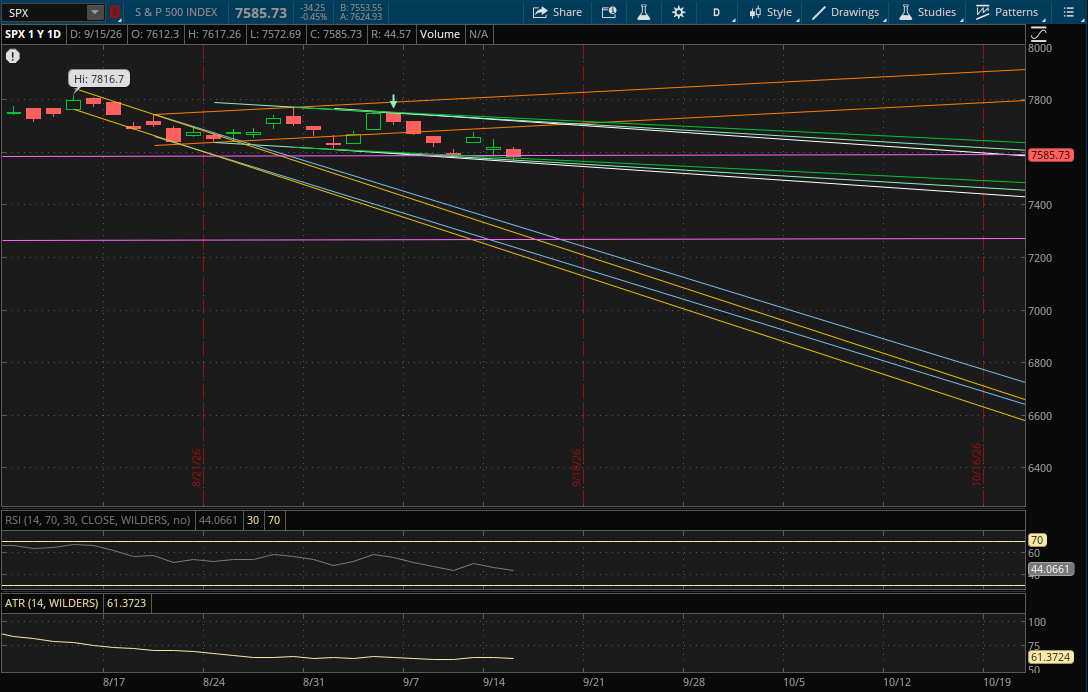
The weakness in markets continued today as the Nasdaq and Russell 2000 both fell nearly 0.80% while the S&P closed down 0.45%. The VIX was relatively flat, closing up just 0.58%, but it entered backwardation yesterday and remained in it again. Tomorrow is the big Fed rate decision and odds have continued to shift in favor of a 25bps rate hike, with the market giving it nearly a 95% chance of happening while unchanged sits at just 5.5%. The market also is pricing in 3 more hikes by mid-2027.
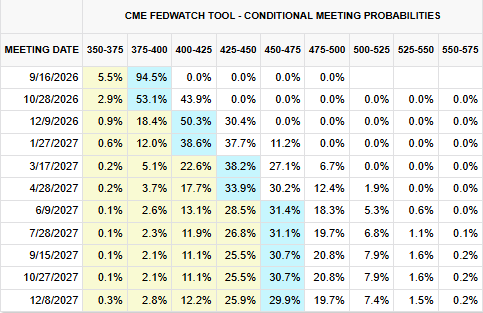
Source: CME FedWatch
From a technical perspective, the Nasdaq bounced right off its primary downtrend support again, so it doesn't start any new daily ranges for tomorrow. If there is a rally on the Fed's decision tomorrow, the primary downtrend (white) will be the first resistance to watch around 26,625 which is about 2.5% away from today's close of 25,981. If it breaks through it, the last daily resistance in play will be from its prior uptrend (orange) right around 26,800.
On a continuation of the pullback, its primary downtrend (white) will again be the first support to watch around 25,930 which is just below today's low of 25,943.31. If it breaks this time, the next support will be from its prior downtrend (blue) around 25,685 which is just over 1% away. If this doesn't hold, the next support will be from its next downtrend (yellow) around 25,380 which is about 2.3% away. There would be more support just below that from its previous downtrend (blue again - bottom of the range) around 25,335 which would likely be the last daily support that comes into play for tomorrow. It's also worth noting that the Nasdaq did open below its primary weekly uptrend support yesterday, so I still think that the risk in the near term remains to the downside.
The S&P also remained within its primary downtrend again today, so it doesn't start any new daily trends for tomorrow. We'll look at resistances first in the event of a rally. The first will be from its prior uptrend (orange) right around 7,700 which is 1.5% away. If it can break through it, there will be several more resistances at 7,715-7,720 from both its primary downtrend (white) and next downtrend (teal) with the last being at 7,725-7,730 (green). So there will be 3 resistances between 7,715-7,730 to watch for.
On a continuation of the pullback, the first level to watch will be at 7,589-7,590 which will be resistance unless it can gap back over it in the morning. The S&P closed just under it at 7,585.73 today, so it's essentially a toss up for whether it opens above or below it. If it opens above it, it will act as support and vice versa if it's below it. After that its next downtrends (green and teal) will be supports at 7,575 and then 7,565 with more just under that at about 7,560 from its primary downtrend (white). These levels aren't very far, so if there is a market sell-off on the Fed these will likely be taken out. In which case, the next daily support to watch is all the way down to around 7,300 from its previous downtrend (blue). This is nearly 4% away so it's unlikely that it's actually tested tomorrow. Instead, the next supports I would watch are from its weekly supports at 7,450, 7,415-7,420, and 7,390-7,395 (see the weekly update for more details).
The Russell 2000 continues to trade in its big primary daily downtrend so it also doesn't start any new daily ranges for tomorrow. It did finally break through its first support (blue) which it held on the last couple of attempts prior to today. Since it broke and closed below it today, this downtrend (blue) will now be the first resistance level to watch on a rally attempt tomorrow which will be at 2,883-2,884. If it breaks through it and we get a big rally on the Fed tomorrow, the next resistance to watch will be from its primary downtrend (white) at 2,953-2,954 which is nearly 3% away.
If the sell-off continues, the next support to watch will be from its primary weekly downtrend at 2,845-2,847 (see the weekly update for more details). If that weekly support doesn't hold, the next daily support will be at about 2,840 from its prior downtrend (yellow). This same downtrend would be the next support (from the bottom of the range) at 2,785. Finally its primary downtrend (white) would be the last daily support to watch at 2,770-2,775 which would be about 3.5% away.