Over the weekend President Trump said that they had scrapped plans to attack Iran energy sites after there were reports that Iran wanted to negotiate. Oil closed down over 5% on this news and yields also pulled back after the 10 year treasury yield hit its highest levels since January of 2025. Markets rallied on this positive development with tech leading the way as the mega cap hyper scalers continued to run after earnings. The Nasdaq closed up 2.13% while the S&P added 1.48 and almost hit all time highs again. Small caps were also strong with the relief in yields and oil as the Russell 2000 jumped 1.73%. Despite the strong rally, the VIX didn't move much, but it closed down almost 1% at $15.86.
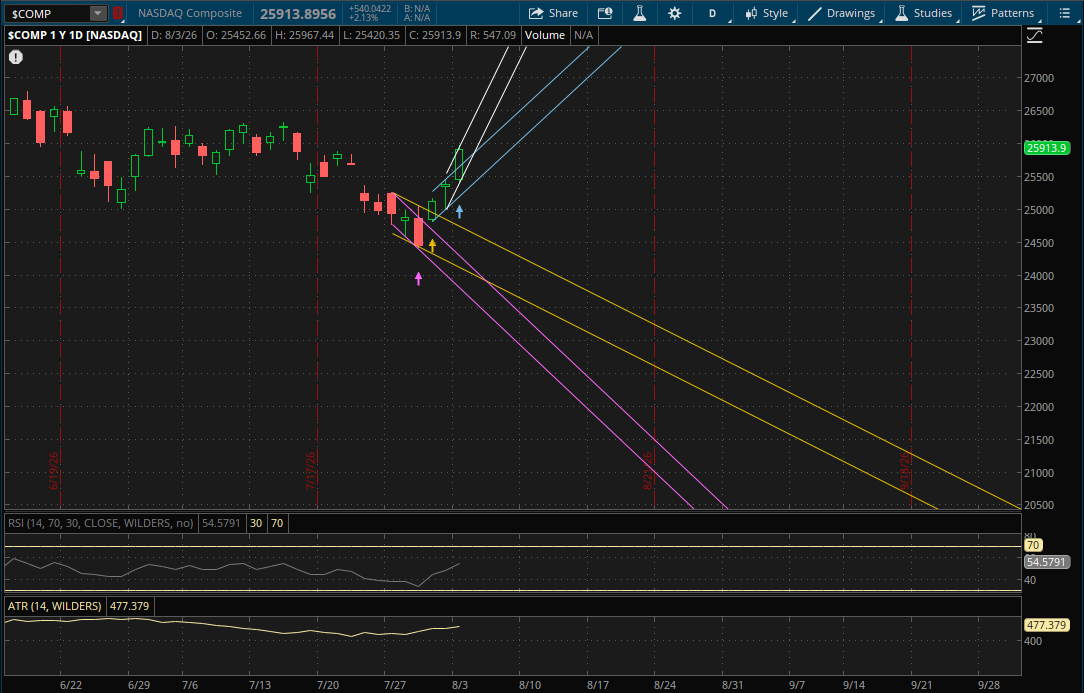
The Nasdaq had a strong close above its prior daily uptrend, which now starts a new primary daily uptrend for it going into tomorrow. The only daily resistance level to watch will be from its new primary uptrend (white) on a continuation of the rally tomorrow. That will be resistance at 26,375-26,400. On a pullback, the first big support to watch will be around 25,850 from both its primary uptrend (white) and previous uptrend (blue) which they intersect at. That will likely be the only support level that comes into play tomorrow. But, if there were a big sell-off again the next support in play would be at 25,375-25,400 from its prior uptrend (blue - bottom of the range).
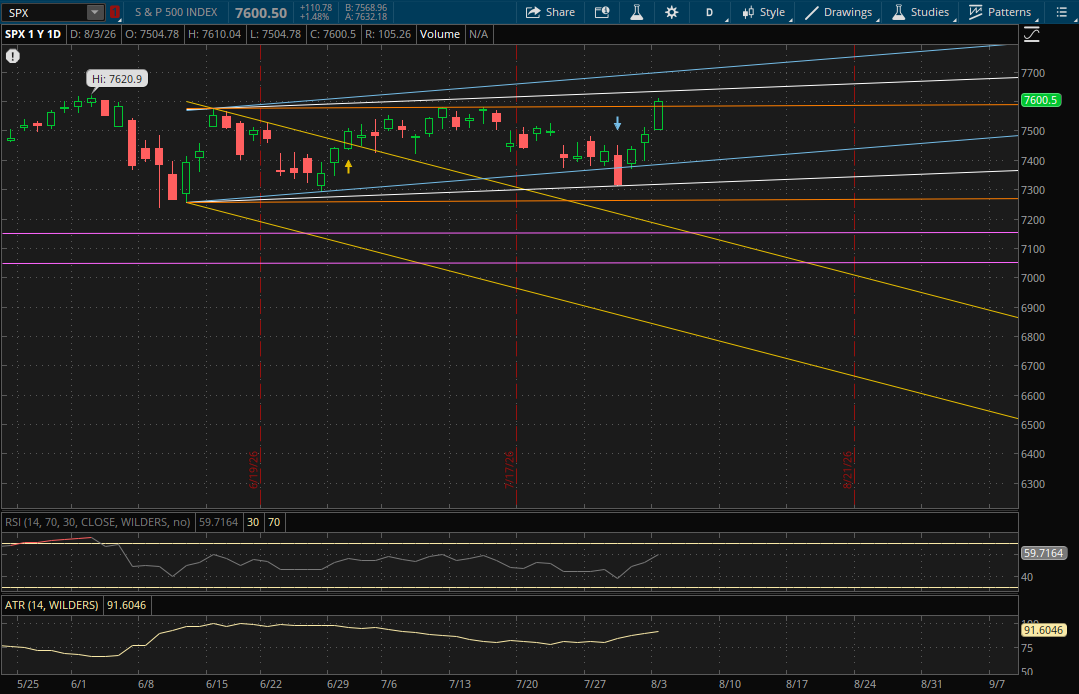
The S&P also broke and closed above its previous sideways range, starting a new primary daily uptrend (white) for it. The first resistance level to watch will be from this new primary uptrend at about 7,638 tomorrow which would be new all time highs for it. If it can break through that, the last daily resistance in play will be right around 7,700 from its prior uptrend (blue).
On a pullback, its prior sideways range (orange) which it closed above today will be the first support level to watch at 7,583-7,584. If that doesn't hold, its next support will be from its prior uptrend (blue) at about 7,390 in the event there is a big sell-off. The last support would be from its primary uptrend (white) at 7,320-7,325.
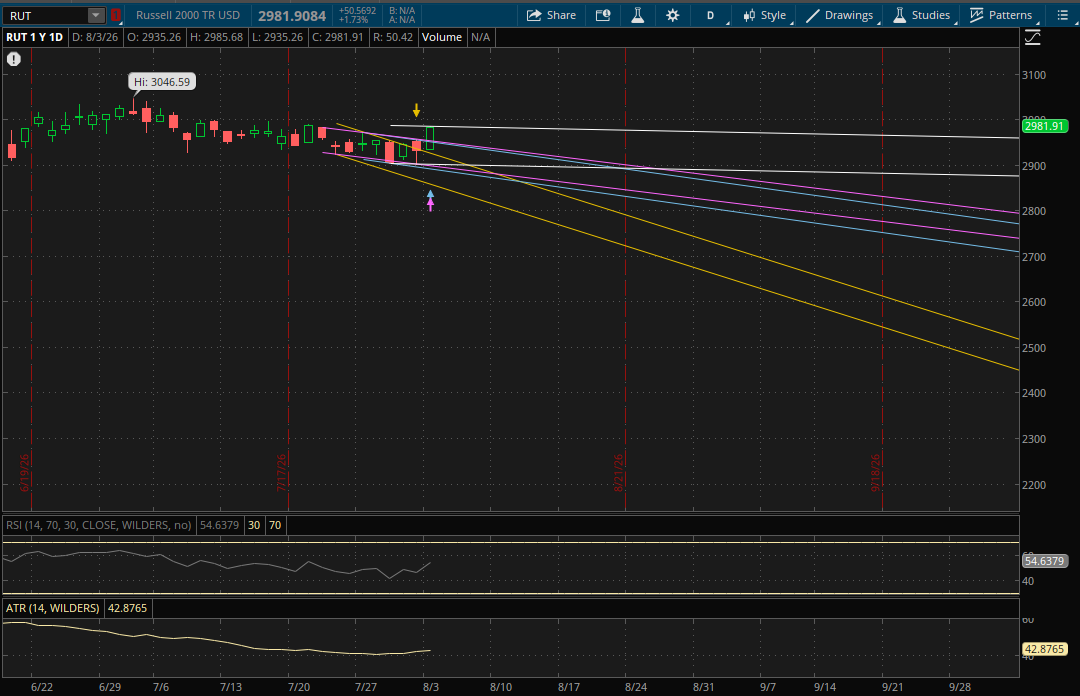
The Russell 2000 had a failed breakout on Friday, but it gapped above its retest resistance this morning and quickly broke through its prior downtrends. It now starts a new primary trend which is a sideways range (white). This will be the first resistance level to watch at about 2,985 tomorrow. The Russell 2000 closed at about 2,892 today so there is potential for a gap above the 2,985 level in which case it would become support on a pullback.
If the Russell does not get the gap above 2,985 and that level holds as resistance, the next supports to watch on a pullback will be from its prior downtrends (purple and blue) at 2,947-2,950. If those don't hold, the next support to watch will be from its next downtrend (yellow) at 2,915-2,917. Finally the last support potentially in play on a larger sell-off would be its new primary range (white) right around 2,900.