The markets continued lower this week with tech being the biggest drag as the Nasdaq lost 2.1% for the week. While there has been a rotation out of the semiconductor/AI trade and into small caps, the Russell 2000 also closed lower by 1.1%. The S&P was the best performing index, but it also posted a weekly loss of 0.6%. Oil was the big winner for the week as it jumped over 10% to settle above $90/barrel due to ongoing tensions between the U.S. and Iran. The recent spike in oil has also caused treasury yields to spike on rising concerns of inflation again. The 10 year treasury yield hit a high of 4.713% this week, hitting its highest level since January of 2025. This comes just ahead of next Wednesday's Fed rate decision. There were recently two very cool inflation reports that came out which sent odds of a rate hike significantly lower. However, those odds have shifted with the recent spike in oil. For Wednesday's meeting, the current odds of a 25bps rate hike sits at about 38% while no change in rates is at about 62%.
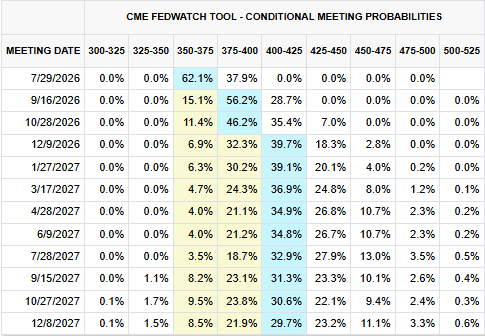
Source: CME
Along with the big Fed rate decision next week, the market will continue to focus on corporate earnings. This week we got reports from Alphabet, Intel, and Tesla, and the market punished all three stocks. Next week the mega cap earnings continue with Microsoft (MSFT) and Meta (META) reporting on Wednesday after the market close followed by Amazon and Apple reporting on Thursday after the close.
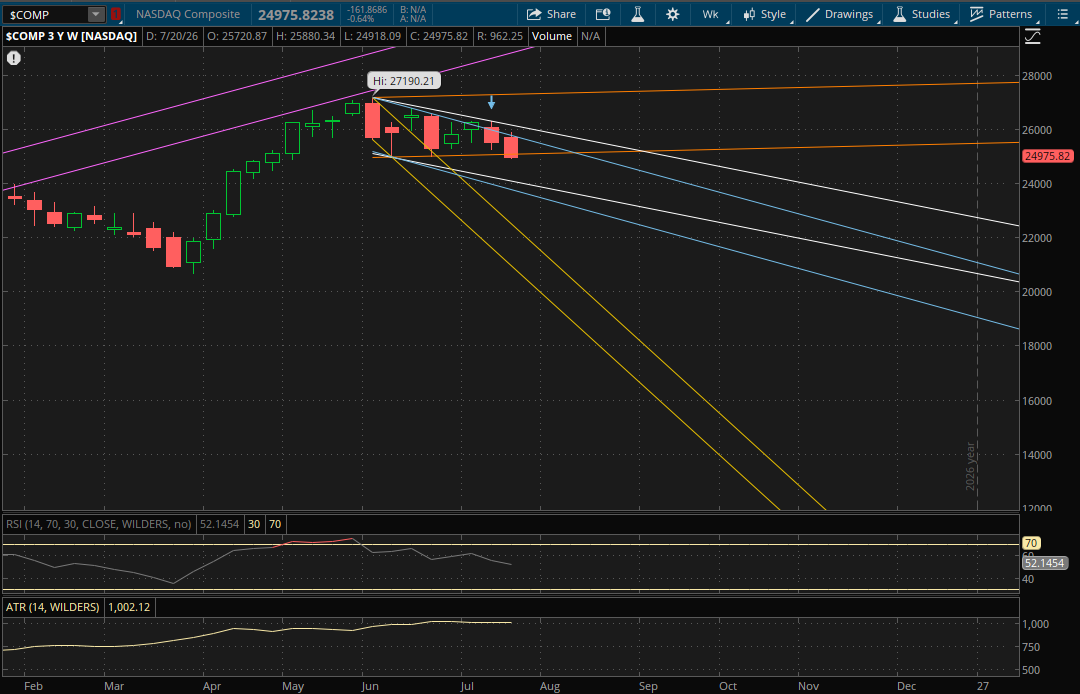
Looking at the technical setup for markets now - it was a weak finish for the Nasdaq this week. The Nasdaq did break and close below last week's primary uptrend which now starts a new weekly downtrend for it. The first key level to watch next week will be its previous primary uptrend (now orange) which it closed below today. That will be support/resistance right around 25,100. If the Nasdaq can gap back above it on Monday, this area will act as support. The Nasdaq closed at 24,975 today so it's only about 0.5% away which is doable. If it can get this gap up, then the next resistance level to watch on a rally attempt would be from its prior downtrend (blue) at 25,575-25,600. If it breaks through this level, the last weekly resistance in play would be from its new primary downtrend (white) at 26,000-26,025.
If the Nasdaq fails to get the gap back above the 25,100 level on Monday then this prior uptrend (orange) will act as resistance on a rally attempt. From there on a continuation of this sell-off, the next weekly support will be from its new primary downtrend (white) at 23,950-23,975. If that doesn't hold, the last weekly support that would potentially be in play for next week would be from its prior downtrend (blue) around 23,575.
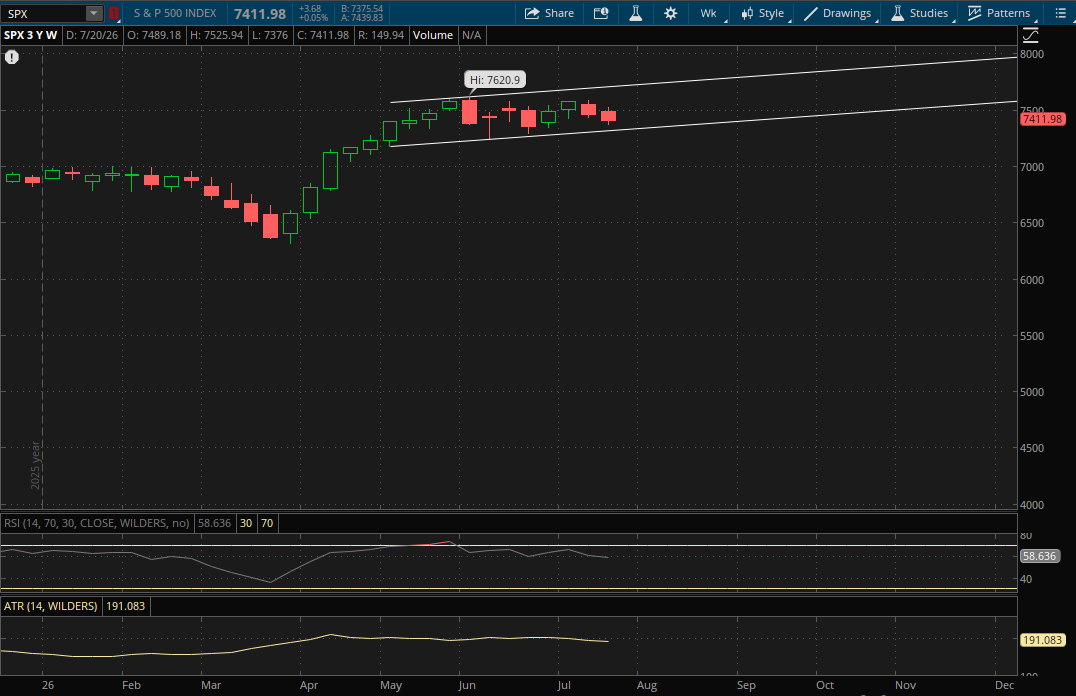
The S&P did not break through its primary weekly uptrend that it has been trading in since early-May, so it doesn't start any new trends again for next week. This primary uptrend (white) will be the only range to watch for next week with support at 7,325-7,330 and resistance at 7,720-7,725. If it does break through it one way (lower end is much more likely) then it will start a new trend for the following week going into August. However, we will first need to see how it closes to determine the direction of that new trend.
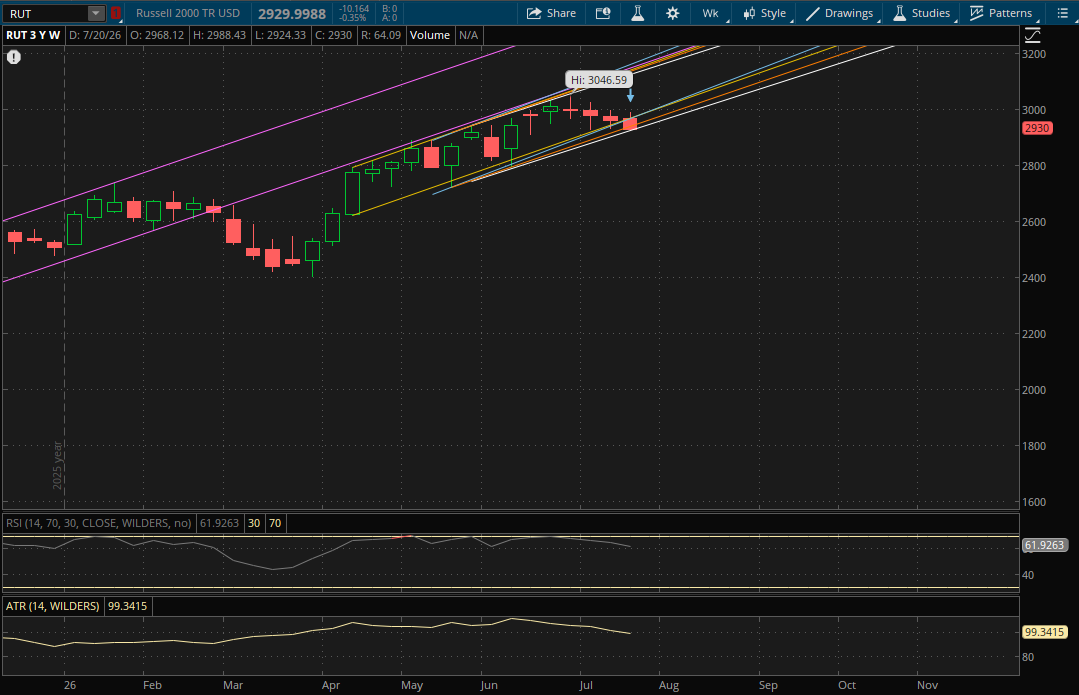
The Russell 2000 broke and closed below its previous primary uptrend, but it still starts a new uptrend for now. However the problem is that it was a very weak finish just off of the lows of the week and it will have to gap up on Monday to open above its new primary uptrend (white) which will be at 2,948-2,949. This is about 0.6% away from today's close of 2,929.99. If it can get this gap up, the 2,948-2,949 level will act as support on a pullback and the next resistance level to watch on a rally will be at 2,965-2,966 from its prior uptrend (orange). After that the last resistance area to watch will be at about 2,995 from its next two uptrends (yellow and blue) where they both intersect.
If the Russell 2000 fails to get the gap up above its new primary uptrend (white) at 2,948-2,949 then this level will act as resistance on a rally attempt as well. Right now there are no support levels below it, so if it does gap or break below the new primary uptrend it will start a new trend but we'll have to wait and see how it finishes to determine the direction of that new trend going into the first week of August.