This afternoon President Trump rejected Iran's proposal to end the war and a report out of Axios said that Trump is considering military action against Iran. This brought stocks off of their highs this morning and sent oil higher as it closed up 3%, just shy of $100. Despite this news, the markets did finish a bit higher today. Small caps led with the Russell 2000 closing up 0.33%, though it was near the lows of day. The S&P added 0.19% while the Nasdaq lagged with a 0.10% gain. However, the VIX jumped nearly 7% and closed near the highs of day. I've noted in the past few updates that the VIX has been relatively strong even with the market continuing to rally to new highs every day. Tomorrow morning markets will get CPI data which will give us a look at the current inflation situation.
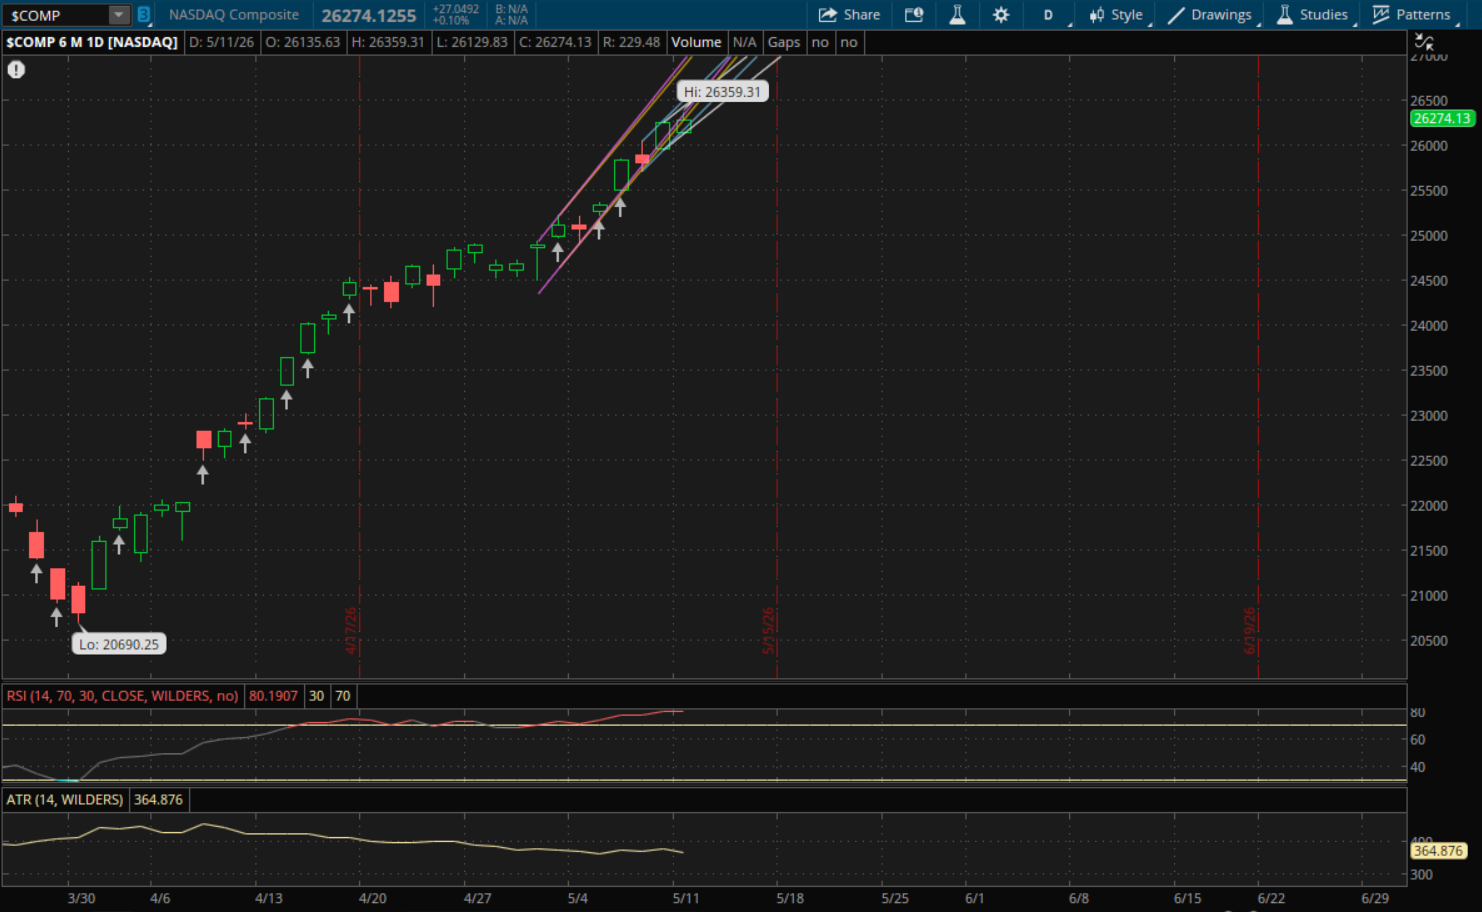
In my last daily update, the first level for the Nasdaq I said to watch out for was about 26,350. It needed to gap above this first resistance level this morning in order for it to act as support. The Nasdaq failed to get that gap up, so it ended up being resistance on the rally attempt this morning. This level was essentially the high of day as it topped out at 26,359.31, just a hair above it. It did open below Friday's primary uptrend, but it did close back over it which gives it a failed breakdown and starts a new daily uptrend.
Like I mentioned in the last update, the problem now is that it needs to continue to gap up and open above these uptrends in order for them to act as support. Over time this becomes more and more difficult as logically we're just not going to continue to gap up every day, especially after such a parabolic move. It's not necessarily bearish, but generally you'll get some sort of pullback or breather.
For tomorrow, the first level to watch for the Nasdaq will be from its new primary uptrend (white) at about 26,320. It finished below this level today at 26,274. So again, there will need to be a gap above this level tomorrow for its primary uptrend to act as support. The next resistance to watch will be from its prior uptrend (blue) at about 26,410 unless it can also gap above it, in which case it will be support. After that, its next uptrend (yellow) will be resistance at about 26,570 and then its primary uptrend comes back into play from the top of the range at 26,225 with more just above that at 26,640 (purple).
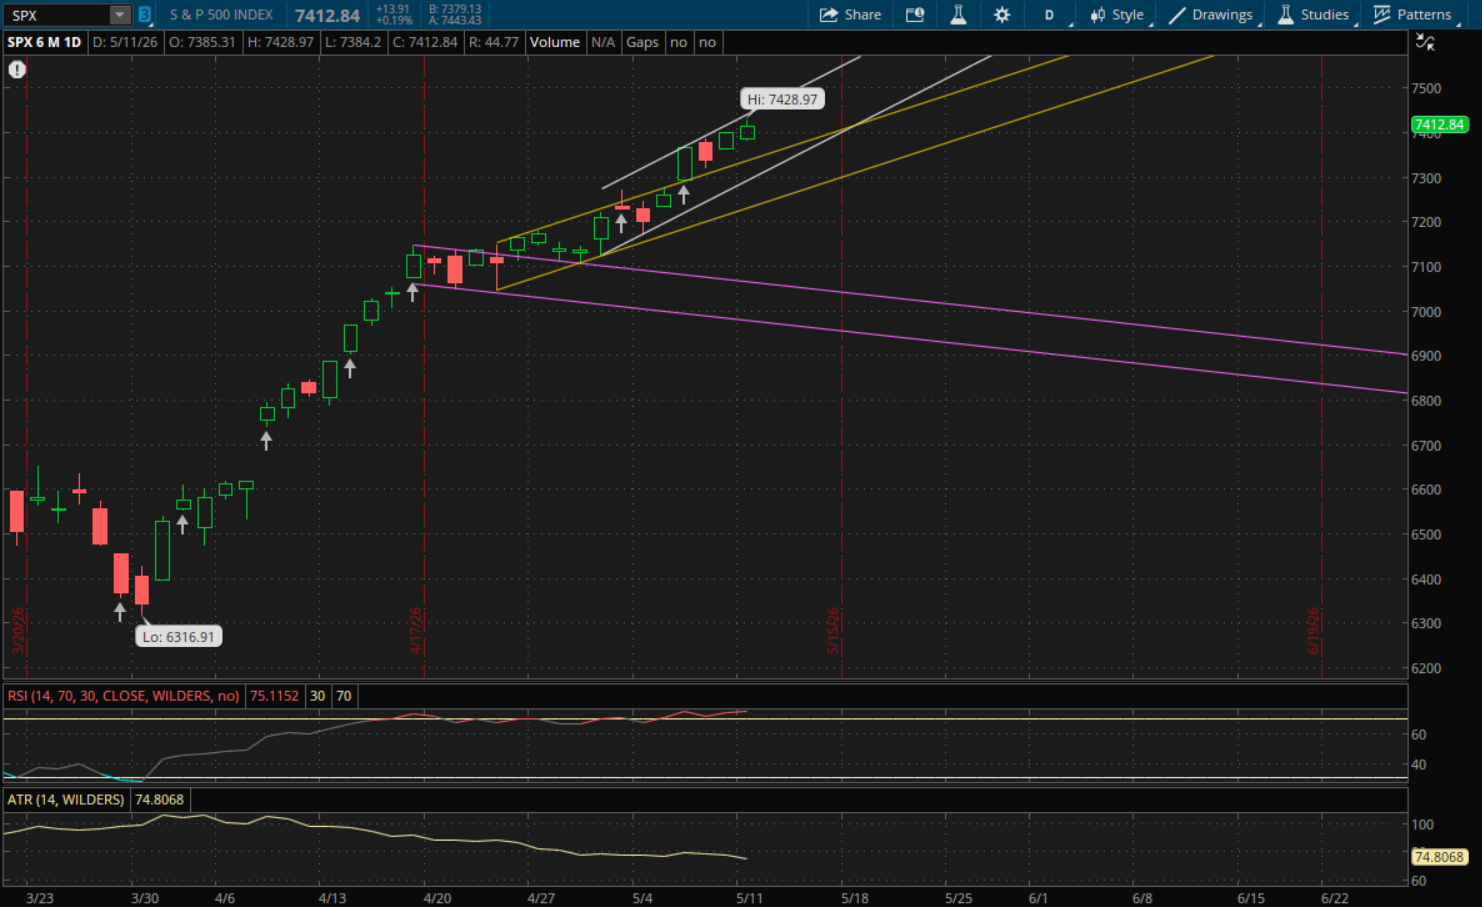
The S&P remained in its primary uptrend again so it doesn't start any new trends for tomorrow. It primary uptrend (white) will be the only resistance to watch again and that will be at 7,465-7,470 for tomorrow. Meanwhile on a pullback, the first support to watch will be from its prior downtrend (yellow) at 7,350-7,355. If that doesn't hold, its primary uptrend comes into play again from the bottom of the range at 7,315-7,320.
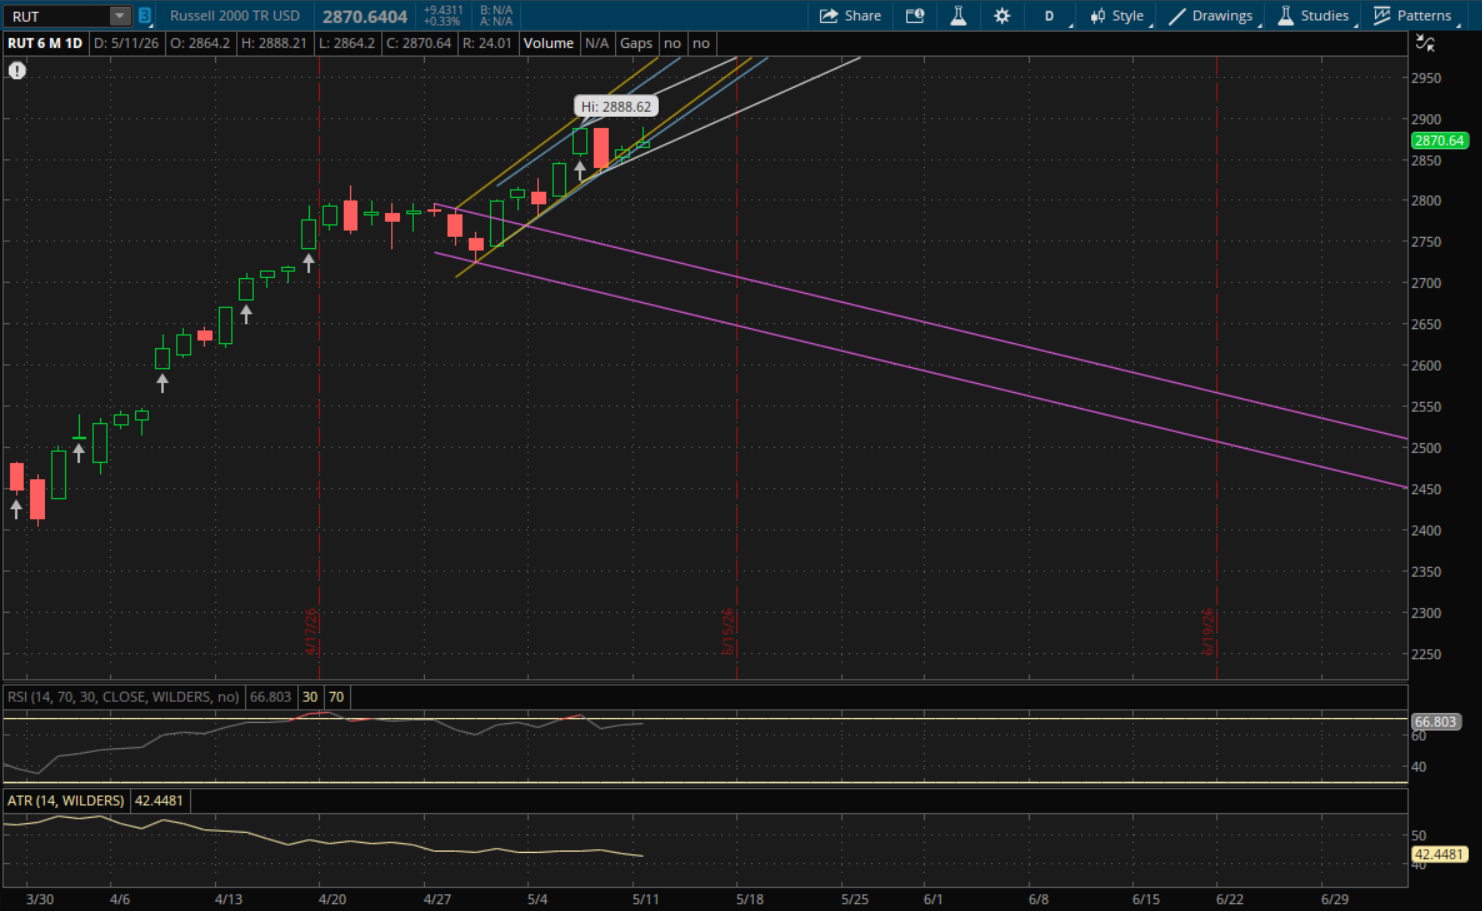
The Russell 2000 also remained in its primary daily uptrend today, so it doesn't start any new trends for tomorrow either. If you read my weekend update, I said that the Russell 2000 had a failed weekly breakout and that I would be looking to buy puts near 2,890 if we got an early rally attempt at this week. This is exactly what happened today as the Russell ran up to 2,888.21 before the end of day pullback to finish at 2,870.64 - near the lows of day. On X/Stocktwits this morning I posted that I entered IWM puts as the Russell was approaching this 2,890 retest resistance. I entered those puts near the high of day and did trim some of them into the close for a 13% profit as I wanted to reduce my risk into tomorrow's CPI print.
For tomorrow, the Russell's primary uptrend (white) will be the first support level to watch at about 2,867. It closed just above it at 2,870 today, so it could potentially gap below this level with the CPI print tomorrow. If that happens, the 2,867 level will act as resistance on a rally attempt. For now that's the only support level to watch and if it does gap or break below it, then we'll need to see how it finishes for the next trend to start.
If the Russell does continue to rally tomorrow, then the next resistance level to watch will be from its prior uptrend (blue) at 2,885-2,887 and then its next uptrend (yellow) will be resistance at about 2,895. However, remember it also has its weekly resistances at about 2,890-2,895 from the failed breakout last week and then its primary weekly resistance is at 2,920-2,925.