The markets were relatively quiet on Friday with the Nasdaq closing lower by 0.28% while the S&P fell 0.17%. Small caps led with the Russell 2000 finishing up 0.51%. The VIX on the other hand hit a new low for the year, falling to $14.18 before settling at $14.25. Since 1990 the average for the VIX is $19.45, so current levels near $14 are historically low and hedges are cheap. However, volatility can remain low for long periods of time. In fact, the VIX has traded below $15 in about one-third of trading days since 1990. So while concerning, it's not necessarily an imminent signal to be bearish on markets.
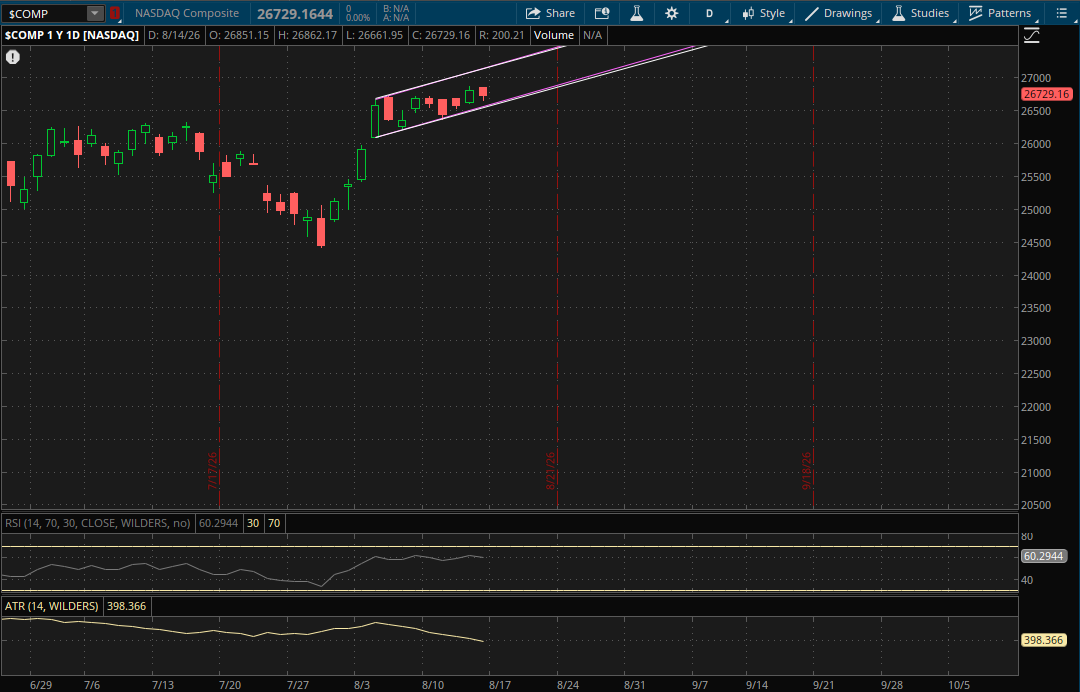
Technically, the Nasdaq remained within its primary daily uptrend on Friday so it doesn't start any new ranges for Monday. On a rally attempt the 27,200-27,225 area will be resistance to watch from its primary uptrend (white) and prior uptrend (purple). These are the only two ranges in play on a daily time frame right now so they will be the only supports to watch on a pullback as well at 26,600-26,625.
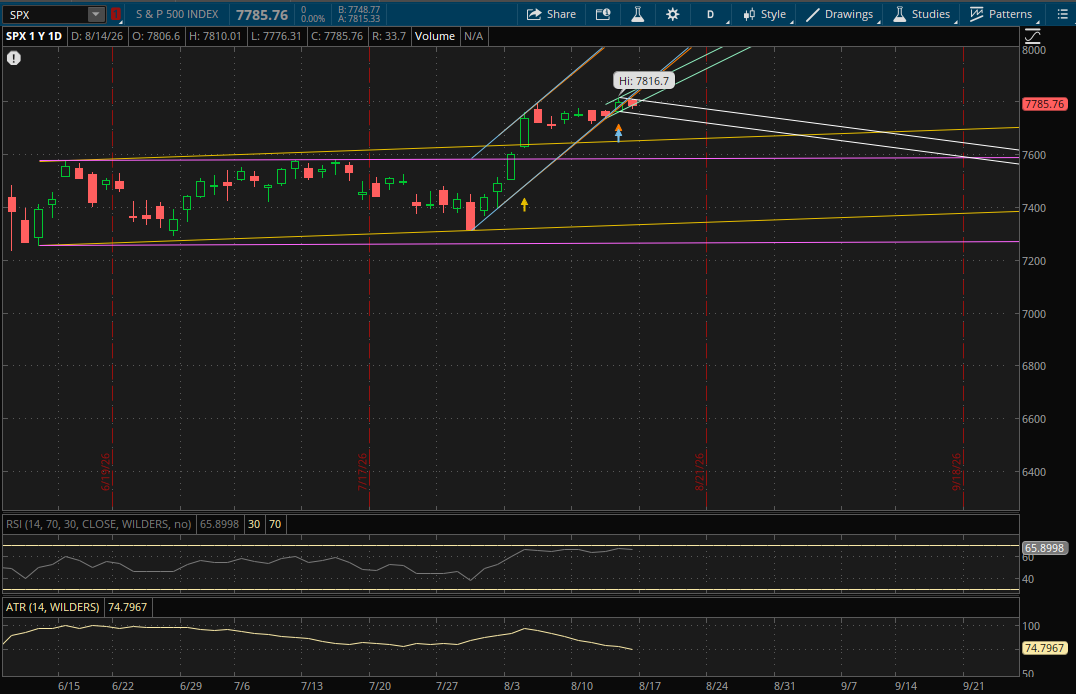
The S&P did break down a bit on Friday as it failed to open above its prior uptrends from Thursday's failed breakdown and it also broke and closed below the primary uptrend that it started for Friday's session. This now starts a new primary daily downtrend (white) for it heading into Monday. Although, it wasn't a very strong breakdown and its new primary downtrend is also a pretty narrow range.
The first resistance to watch on a rally attempt will be from its new primary downtrend (white) at about 7,803 on Monday. If it can break through it, the last resistance potentially in play would be its prior uptrend (teal) that it closed below on Friday. That will be resistance at about 7,815.
On a continuation of the pullback from Friday's breakdown, the first support to watch will be from its new primary downtrend (white) right around 7,750. If it doesn't hold, the next (and likely last) support to watch on Monday will be from its prior uptrend (yellow) at about 7,655 if we get a larger sell-off.
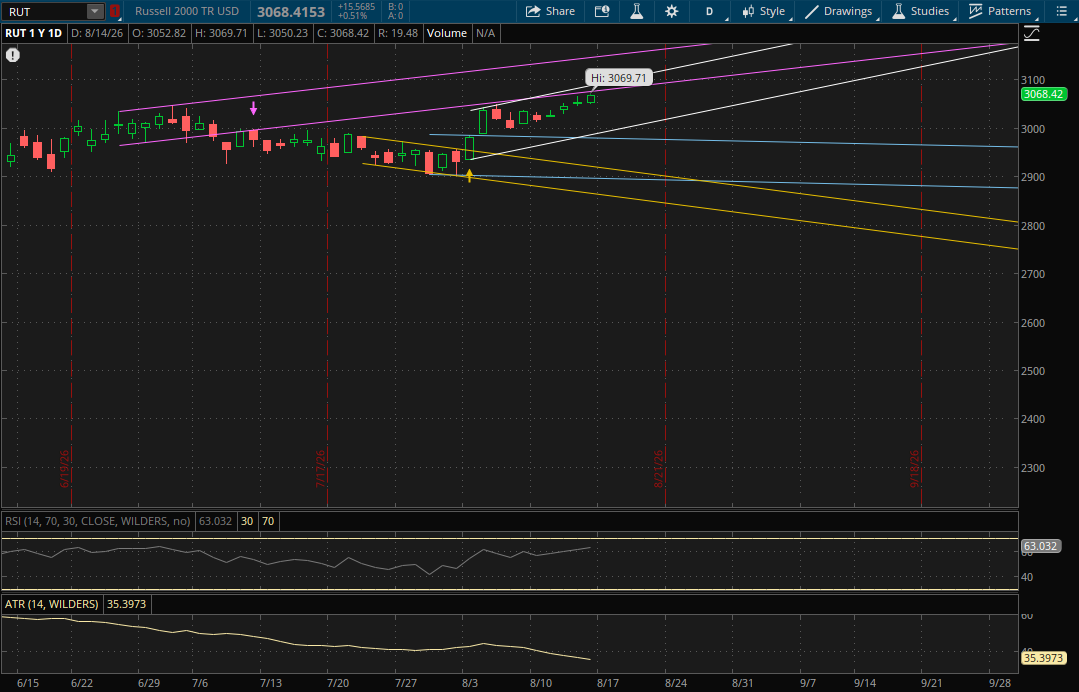
The Russell 2000, which was the leader on Friday, remained within its primary uptrend again so it doesn't start any new daily ranges for Monday. The first resistance to watch will continue to be from its prior uptrend (purple) which will now be around 3,079-3,080 on Monday. If it breaks through it, the last daily resistance will be from its primary uptrend (white) around 3,095.
On a pullback the first support to watch will be from its primary uptrend (white) at about 2,993 which is almost 2.5% away. There would be more support from its prior downtrend (blue) below that at about 2,980, but both are pretty far away and neither may actually be tested even if there is a pullback on Monday.