The markets were weak again today with the Russell 2000 once again being the laggard as yields continue to rise which hurt small caps the most. The Russell closed down another 1% while the Nasdaq lost 0.84%. The S&P was the best performing again, but posted another loss of 0.67%. While the markets did recover from their lows, this will be the first three day losing streak for the S&P and Nasdaq since the bottom on March 30th. With today's pullback, the VIX closed up 1.35% at $18.06, and it was notably weak again even at the lows for markets.
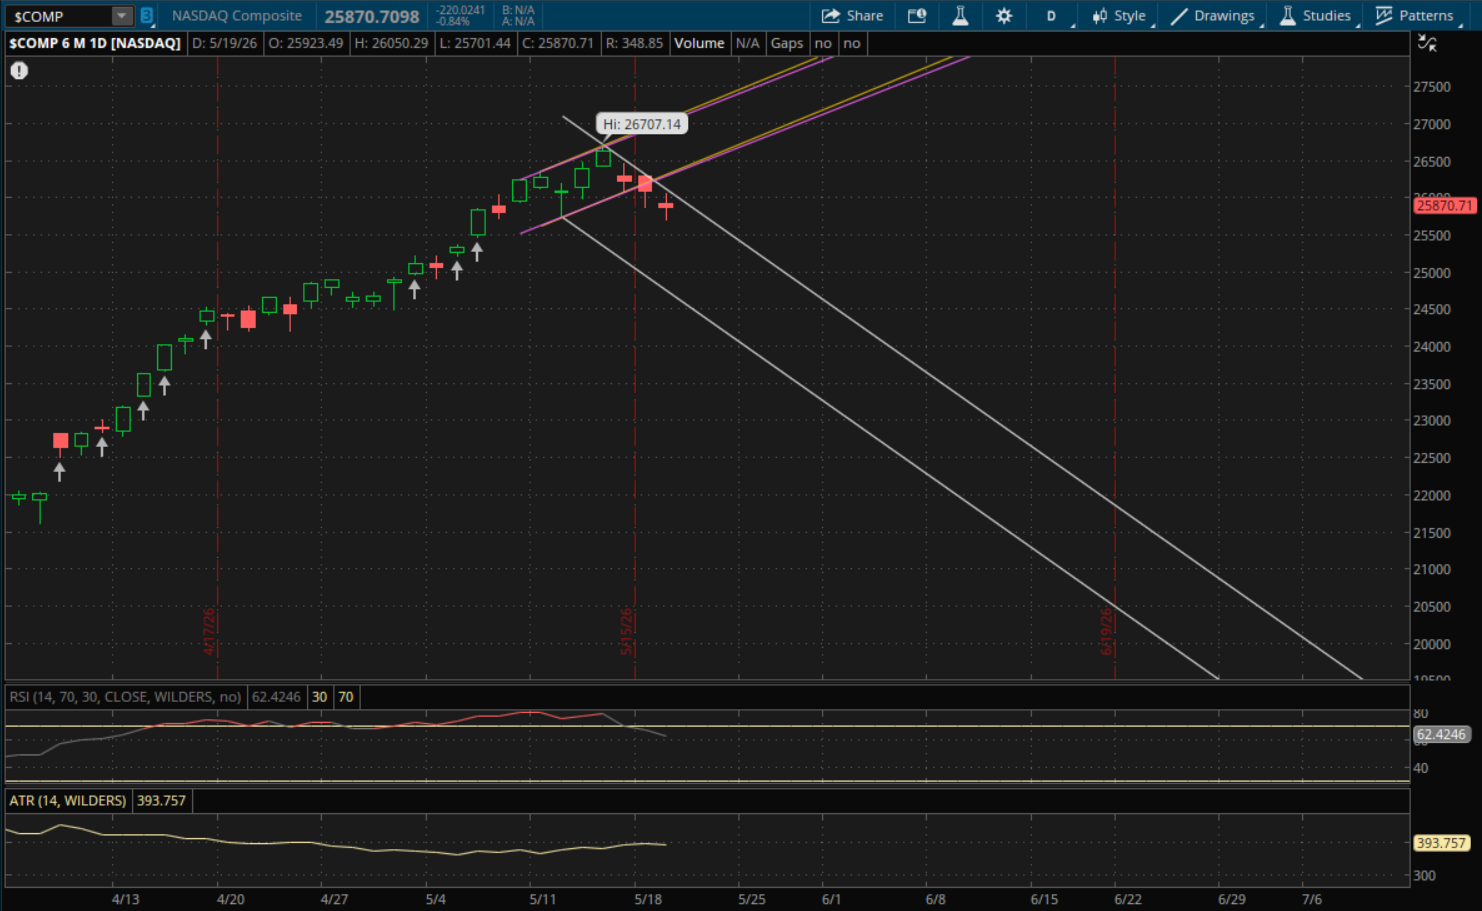
Yesterday I mentioned that the Nasdaq had started a new daily downtrend, which was its first downtrend in quite a while after the parabolic run for the markets. There was potential for it to gap over this downtrend, but it failed to do it this morning and its new primary downtrend (white) acted as resistance on the rally attempt today. It didn't break through it, so it doesn't start any new trends going into tomorrow's session.
For tomorrow, its primary downtrend (white) will be first the key level to watch and that will be just above 25,900. The Nasdaq closed at 25,870 today which is just below that 25,900-25,915 area. So there is once again a chance for it to gap above this downtrend. If it can do it tomorrow, that 25,900-25,915 area will become support on a pullback and retest. If it gets this gap above it, or breaks through it after the open, then the next resistance levels to watch will be at 26,400-26,450 from both of its prior uptrends (purple and yellow).
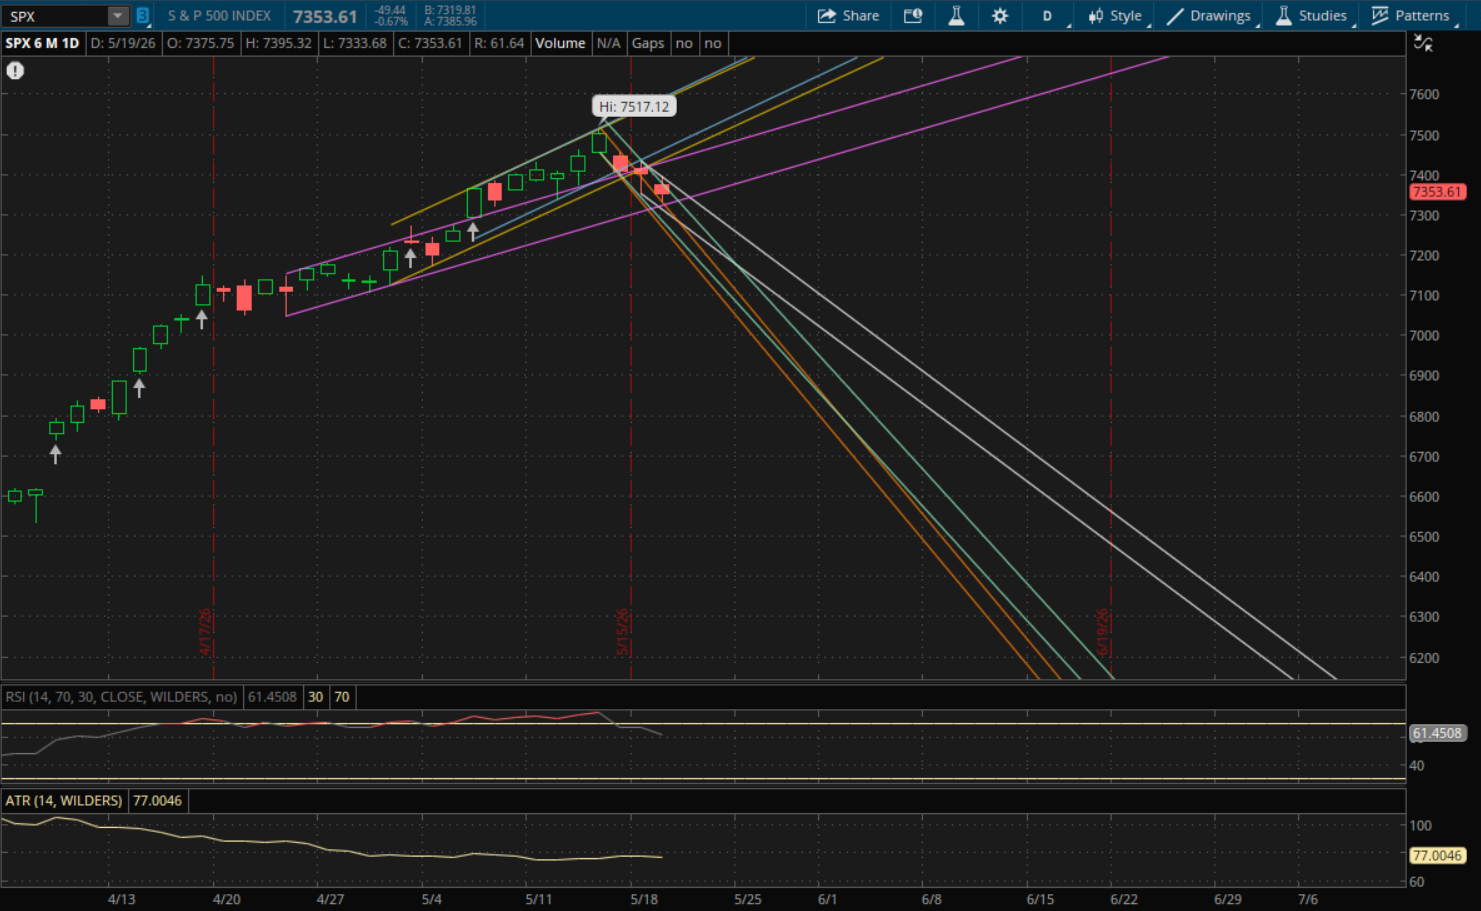
The S&P also failed to open above yesterday's primary downtrend this morning. It did break through it, but it also failed to close above it today which starts a new downtrend for it heading into tomorrow's session. Its new primary downtrend (white) will be at about 7,356 tomorrow which is just above today's close of 7,353. There will again be potential for it to open above this new downtrend tomorrow if it can gap up a bit in the morning. If it does open above 7,356, that level will become support. And if it does gap above it, or break through it, then the next resistance to watch on a rally attempt will be at 7,445 from its prior uptrend (purple). After that, its next uptrend (yellow) will be resistance at 7,460-7,465 and its last uptrend (blue) will be the final resistance at about 7,485 in the event of a big rally.
If the S&P fails to open above its new primary downtrend (white) at 7,356 tomorrow then it will remain as resistance and the next supports to watch on a continuation of the pullback will be at 7,338-7,339 (purple), 7,319-7,320 (teal), and then its primary downtrend (bottom of the range) comes back into play at 7,275. If its primary downtrend doesn't hold, then it will start a new trend heading into Wednesday, but we'll need to see how it finishes first to get the direction of its new trend. There would also be more support just below its primary downtrend from its prior downtrend (orange) at 7,268.
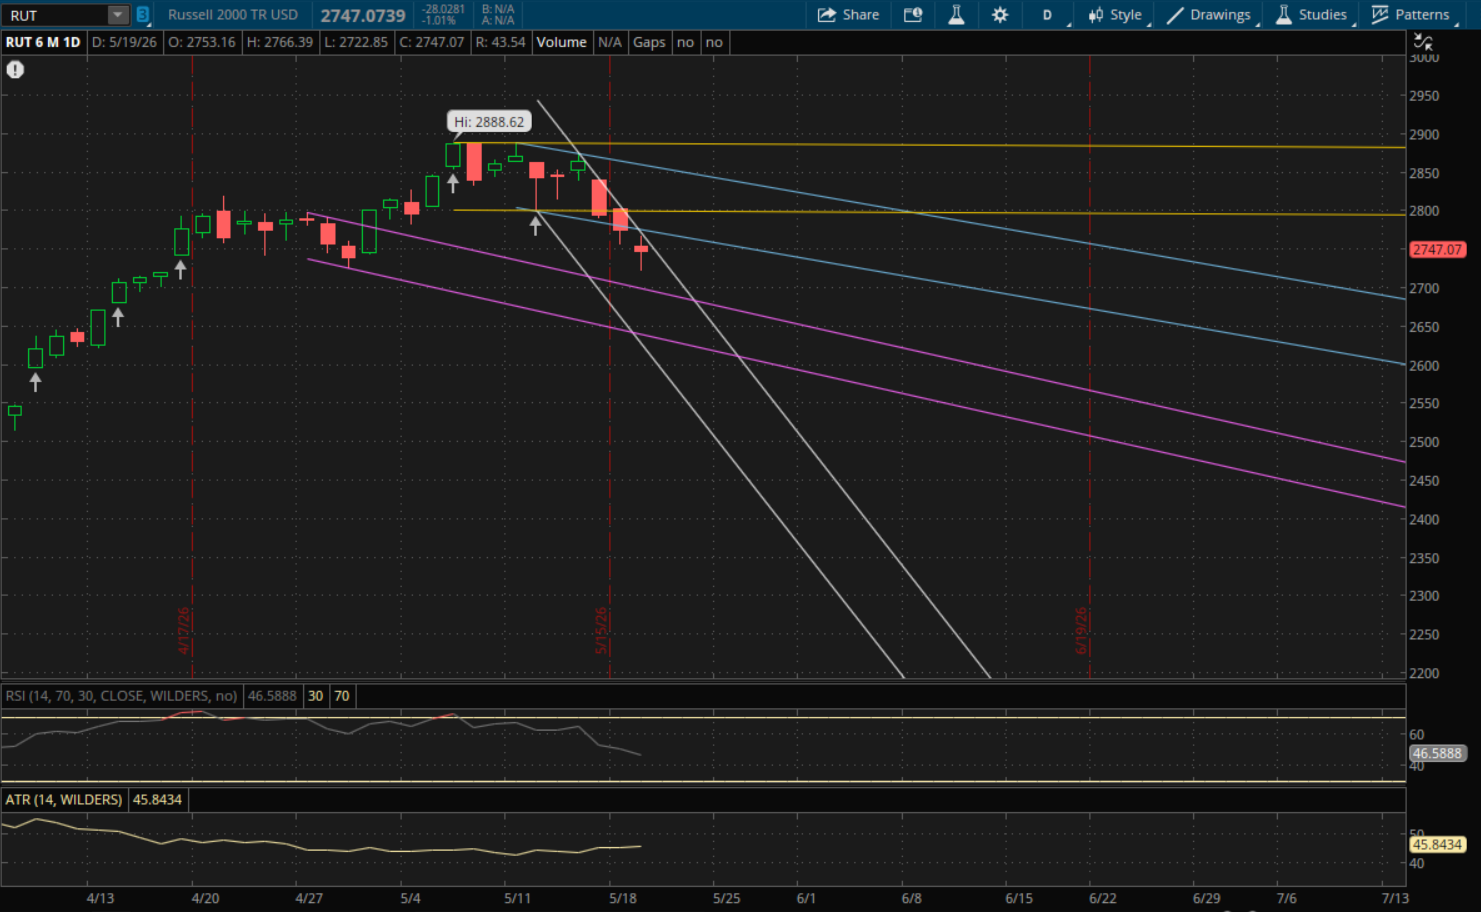
The Russell 2000 gapped below its primary uptrend this morning and remained below it without breaking through it, so it doesn't start any new trends for tomorrow. This morning I actually bought the dip in it with IWM calls as the Russell was approaching the 2,720-2,725 level which was its primary weekly support that I laid out in my weekend update. This was the bottom for the day as it hit a low of 2,722.85 before rallying to a high of 2,766.39 for the day. I took profits during that bounce and it got rejected just below its primary daily downtrend around 2,770 that I noted in yesterday's daily update.
Since it doesn't start any new trends for tomorrow, its primary downtrend (white) will again be the first level to watch. That will be at about 2,735 for tomorrow. The Russell finished at 2,747 today, well above it, so as long there's no big gap down again tomorrow the 2,735 level will act as support on a pullback and retest. From there, the next resistance to watch on a rally will be at about 2,770 from its prior downtrend (blue) and if there's a big rally the next level to watch will be just below 2,800 from its next trend (yellow).
If the Russell does have another big gap down below its primary downtrend at 2,735 then this level will act as resistance again on a rally attempt. And the next support to watch on a continued pullback will be at about 2,692 from its prior downtrend (purple). However, it will still have weekly support at the 2,720-2,725 range which held during today's sell-off.