Today Treasury Secretary Scott Bessent announced new financial sanctions on Iran called "Operation Economic Outcast", and explicitly mentioning that they would be targeting any countries that help Iran - including China. Before the market opened, there was also news that the Treasury Department could tap its TGA (Treasury general account) of nearly $1T dollars to fund an expanded treasury buyback program. This sent futures higher and yields lower just before the market open this morning. Despite a pullback in yields and oil today, the markets continued lower. The Nasdaq and Russell 2000 both fell 0.76% while the S&P closed down 0.28%. The VIX jumped 4.76% to settle at $15.85.
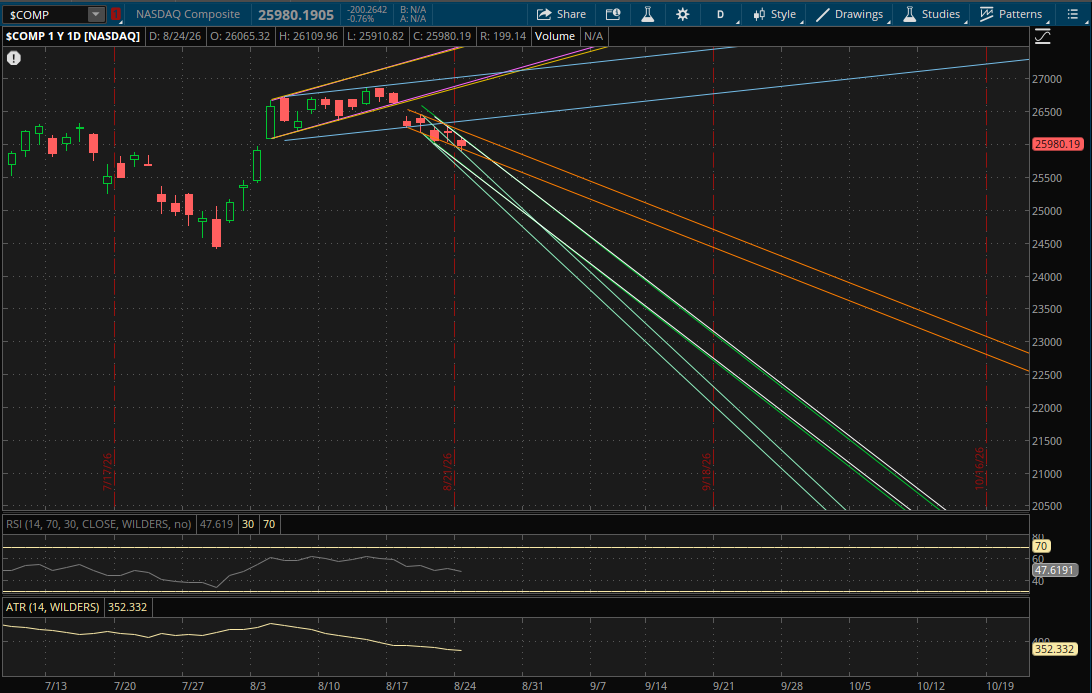
The Nasdaq gapped below its new primary daily downtrend which it started on Friday around 26,100. It broke just above it today, putting in a high of 26,109.96, before pulling back to close below it again. This is a failed daily breakout for it which starts a new primary daily downtrend for it going into tomorrow. The first key level to watch tomorrow will be at 25,940-25,950 from both its new primary downtrend (white) and its prior downtrend (green) which it failed to close above today. The Nasdaq closed at 25,980 today, so it is currently above where those trends will be tomorrow. As long as it doesn't gap back below the 25,940-25,950 level tomorrow that area will act as support. From there, the only resistance that likely comes into play on a rally attempt will be from its prior downtrend (orange) around 26,125.
If the Nasdaq does gap down again below the first two key levels at 25,940-25,950 (green and white) then this area would become resistance again. It's only about 0.15% away from today's close so it wouldn't require a big gap down to do it. If that happens, or even if it opens above that area but breaks down through it, then the next support to watch will be from its prior downtrend (orange) at 25,850-25,860. After that would be its primary weekly uptrend (see the weekly update) at 25,825-25,850. If neither of those hold, its next downtrend (teal) will be support around 25,675. The last two supports that will likely come into play on a bigger sell-off would be from its primary downtrend (white) and previous downtrend (green) from today's failed breakout at 25,525-25,550 (from the bottom of the ranges).
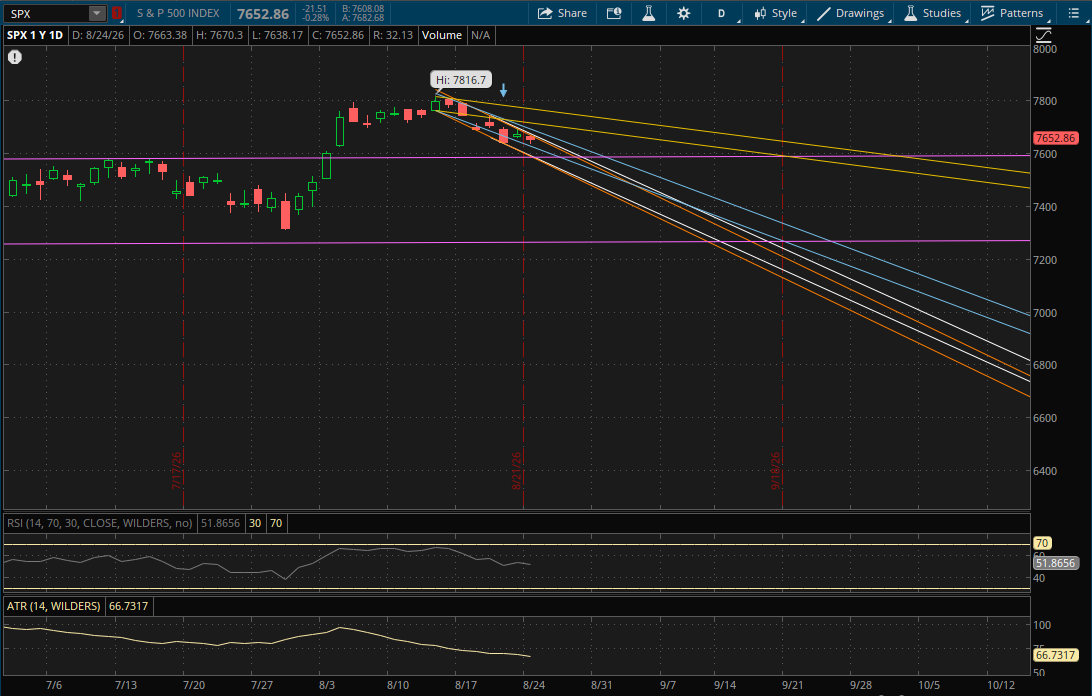
The S&P got rejected right at the retest of Friday's failed breakout around 7,670 this morning after gapping back below it. It didn't break through its primary downtrend, so it doesn't start any new daily trends for tomorrow. Its primary downtrend (white) will be the first level to watch tomorrow at about 7,650 which is just below today's close of 7,652.86. If the S&P opens above 7,650 that area will act as support. Its prior downtrend (orange) from Friday's failed breakout is just below that at about 7,644. The same applies for this level, if the S&P opens above it then it will act as support as well. On a rally attempt the next resistance to watch would then be from its next downtrend (blue) at 7,674-7,675. If it breaks through it, then the last resistance will be from its next downtrend (yellow) at about 7,710.
If the S&P gaps below those first 2 levels at 7,650 (white) and 7,644 (orange) then they will act as resistance on a rally attempt again. If it opens above them but still sells off to break through them, the next support on a pullback to watch will be at about 7,608 (blue). After that, its previous sideways range (purple) will be support at about 7,587. The last 2 supports to watch will be at 7,565-7,570 from both its primary downtrend (white) and Friday's failed breakout (orange) at the bottom of those 2 ranges.
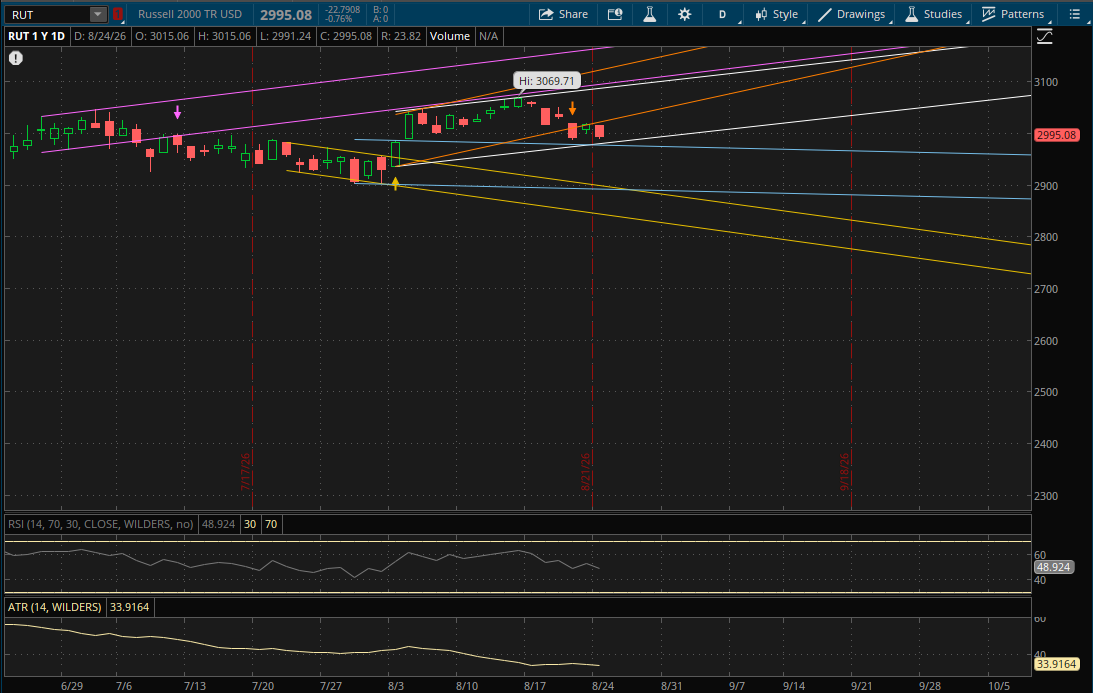
The Russell 2000 did not break through its primary daily uptrend today, so it also doesn't start any new daily ranges for tomorrow. First let's look at resistance - the only resistance level in play on a potential bounce would be from its prior uptrend (orange) at about 3,027 tomorrow.
On a continuation of the pullback, its primary uptrend (white) will be the first support to watch at about 2,983. If that doesn't hold, its next support will be from its prior downtrend (blue) at about 2,976. Those would likely be the only 2 daily supports in play on a sell-off tomorrow but after those its primary weekly uptrend comes into play at about 2,955 (see the weekly update).