Last week the markets inched higher again heading into the long holiday weekend, and over the weekend there was news of the U.S. and Iran nearing a peace deal to re-open the Strait of Hormuz. Markets are closed tomorrow for Memorial Day, but futures are open right now and are higher on these headlines with the Nasdaq and Russell 2000 both up almost 1%. This is in big part due to the sell-off in oil with it currently down over 5% while the 10 year treasury yield is also pulling back as a deal with Iran and falling oil prices will help tame inflation fears. There aren't many big catalysts for this week, but on Thursday we will get the next batch of inflation data with PCE - the Fed's preferred inflation gauge. This will be the first batch of inflation data under new Fed Chair Kevin Warsh who was sworn in last week, replacing Jerome Powell.
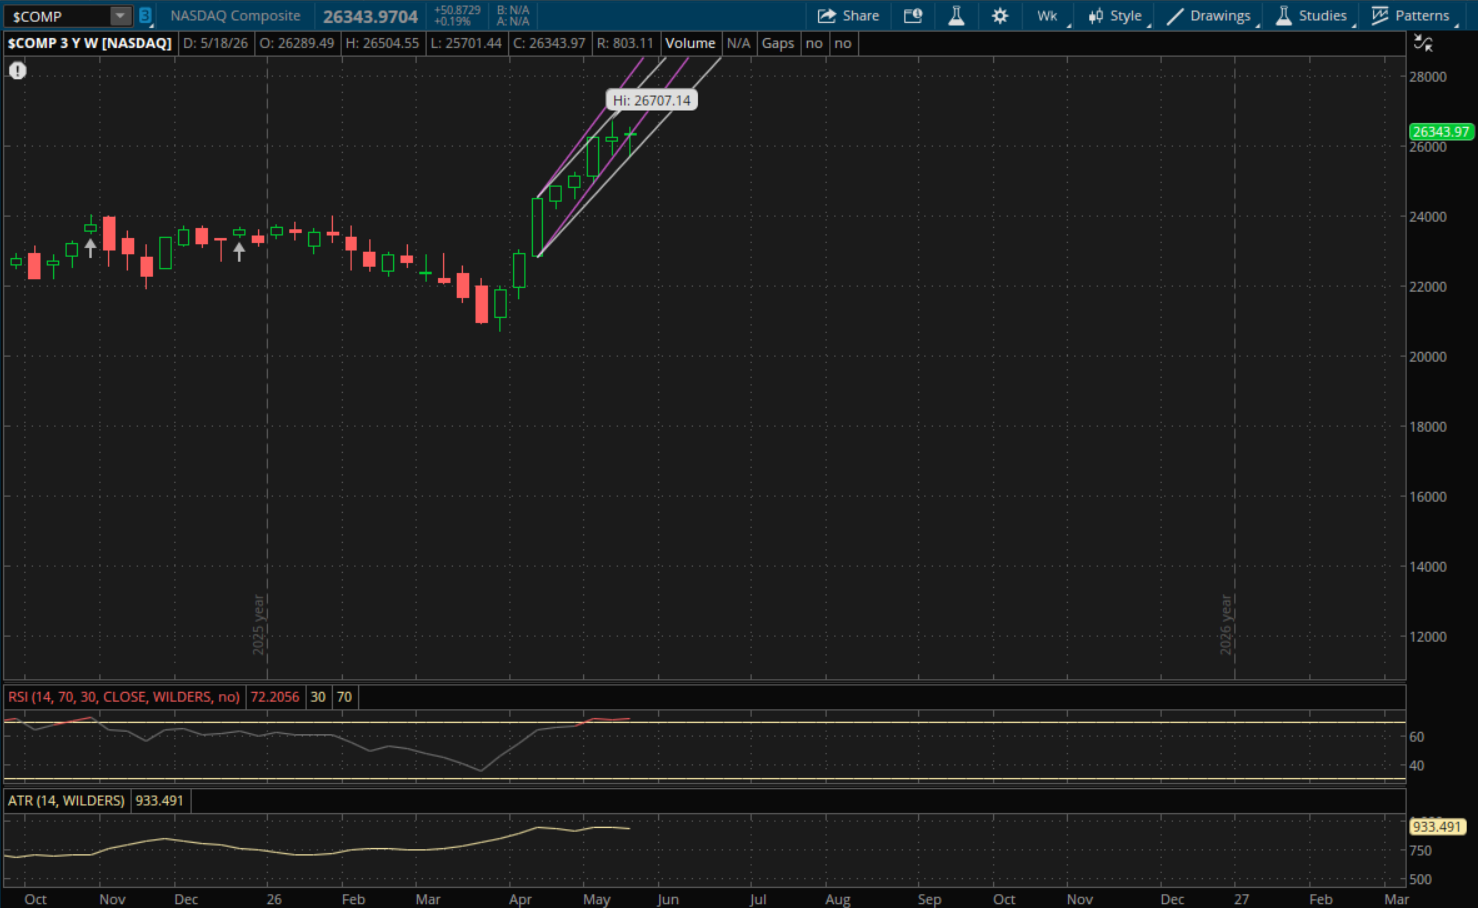
The Nasdaq had a failed weekly breakdown last week which starts a new uptrend for it heading into this week. The first level to watch this week will be from its new primary uptrend (white) at about 26,300 which is just under last week's close of 26,343. If we get an open above this 26,300 level on Tuesday then it will act as support on a pullback. The next resistance to watch on a continued rally will then be at 27,000-27,050 from its prior uptrend (purple). The only other resistance would be from its primary uptrend (white - top of the range) at about 28,000, but this is over 6% away so it's unlikely to be tested. If futures do reverse their gains and the Nasdaq gaps below its primary uptrend support around 26,300 then we will need to wait and see how it finishes the week for a new trend to start as there are no other trends currently.
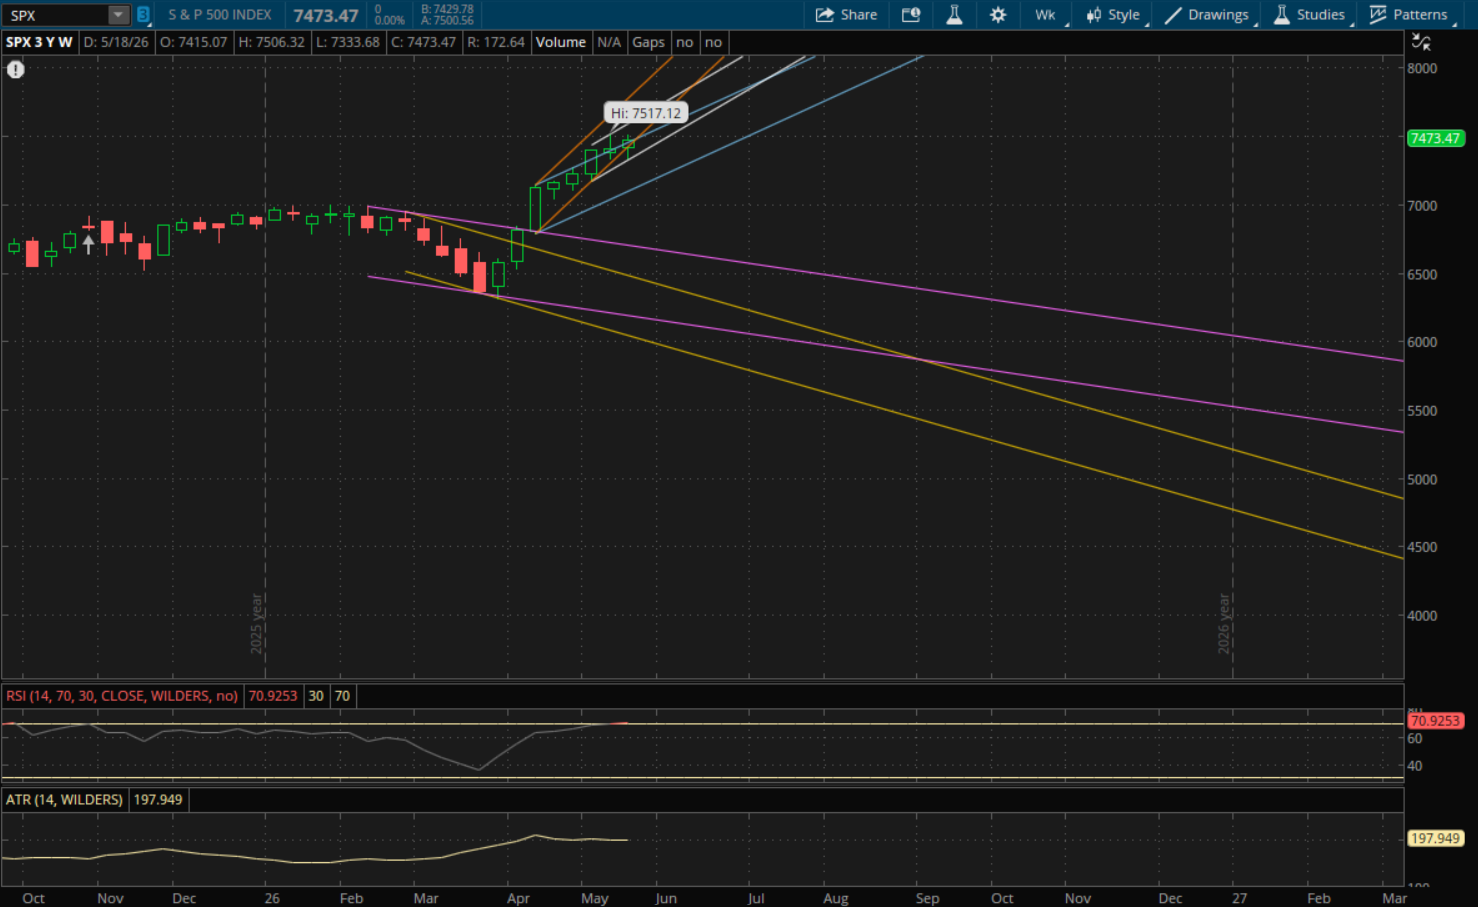
The S&P also had a failed breakdown last week below its prior uptrend and made a higher low which starts a new uptrend for it. Its new primary uptrend (white) will likely be the only support level to watch at about 7,415. If it doesn't hold, it will start a new trend but we'll have to see how it finishes for the direction of the new trend. Meanwhile if the rally continues, the first resistance to watch will be 7,525 from its prior uptrend (blue) with its next uptrend (orange) at about 7,563. If it can break through both of those, then its last weekly resistance will be from its primary uptrend (white - top of the range) at about 7,680.
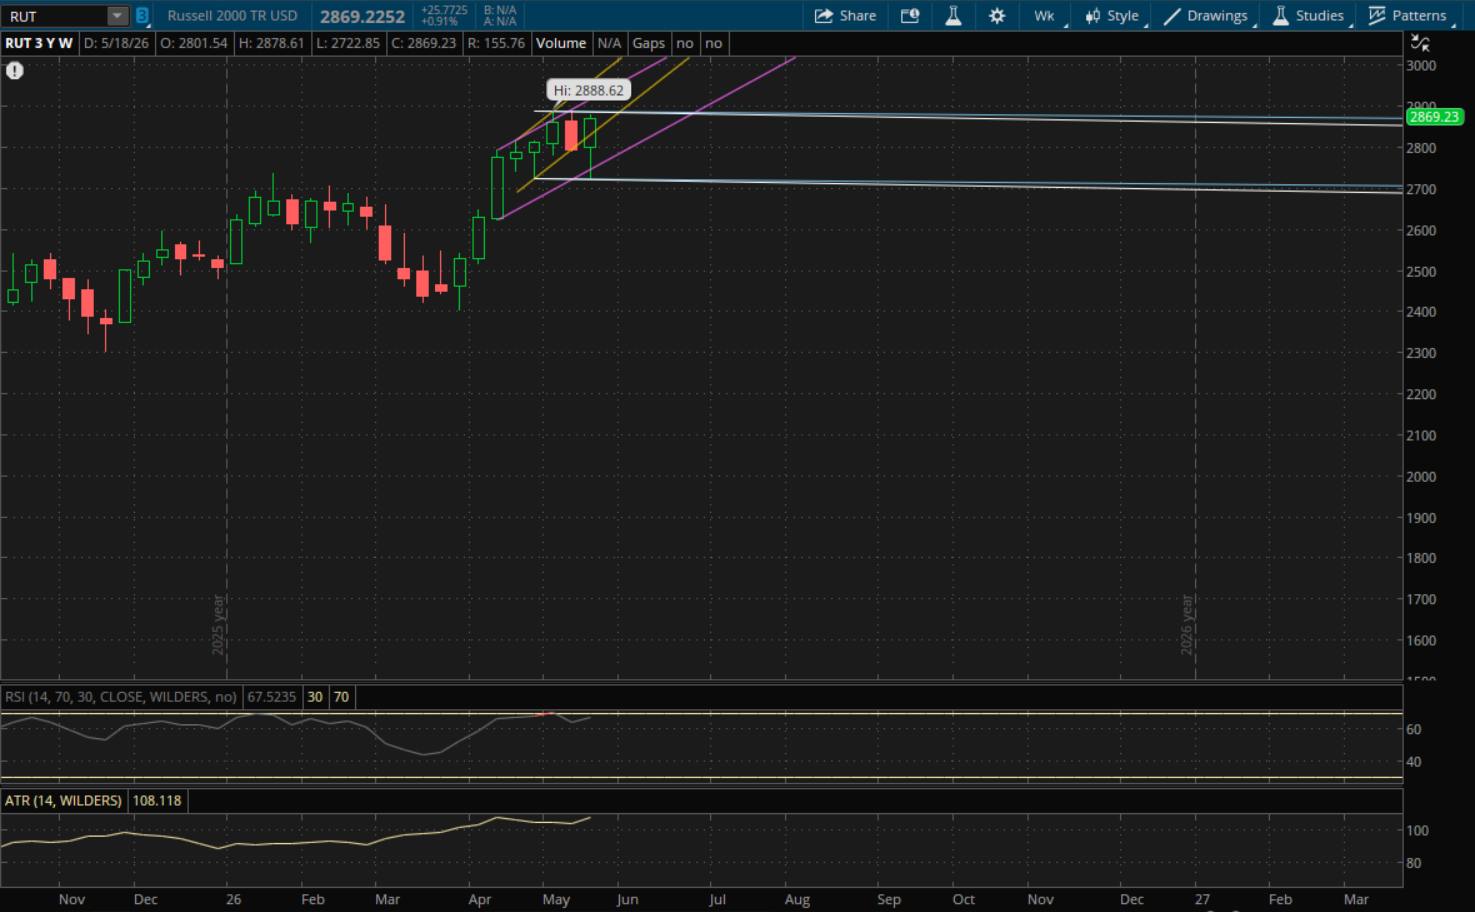
The Russell 2000 also had a failed breakdown just below its previous primary trend at 2,720-2,725. This was the area I talked about in my update last weekend and I bought the dip with IWM calls just above 2,725 during the pullback early this week. It broke just below that trend, putting in a low of 2,722.85, which starts an almost identical sideways trend for it going into this week.
The first area to watch this week will be at 2,785-2,788 which will be from its new primary range (white) and its prior sideways range (blue) from the failed breakdown. It closed at 2,869 on Friday, but it could potentially gap above this level given how futures look right now, in which case the 2,785-2,788 area would become support. After that, the next resistance to watch will be at about 2,943 (purple) and its last weekly resistance would be just under 3,000 (yellow).
If the Russell fails to gap above the 2,785-2,788 level on Tuesday then it will remain as the first resistance area to watch. On a pullback, the first support to watch will be at about 2,868 from its prior uptrend (yellow) which is just below Friday's close of 2,869. If that doesn't hold, then its next uptrend (purple) will be support at 2,772 and its last weekly support will be from both its primary range (white) and retest of last week's failed breakdown (blue) at 2,720-2,725 again which is where it bounced last week.