The markets saw their worst monthly sell-off since March of 2025 during the global tariff rout. For the month, the Nasdaq closed down 4.8% and it entered correction territory as it fell nearly 14% from its all time highs before today's market rally. The Russell 2000 was the worst performing as it closed down 5.2% for the month. It also entered correction territory as it was down 12% from its all time highs set in January. The S&P also lost about 5% for the month, but it was just shy of the 10% correction mark as it fell 9.8% peak to trough. The VIX finished the month higher by 27% despite today's 17.5% decline. It had been up as much as 77% at its highs, and for the year it was up as much as 136% - and it remains elevated at $25.25.
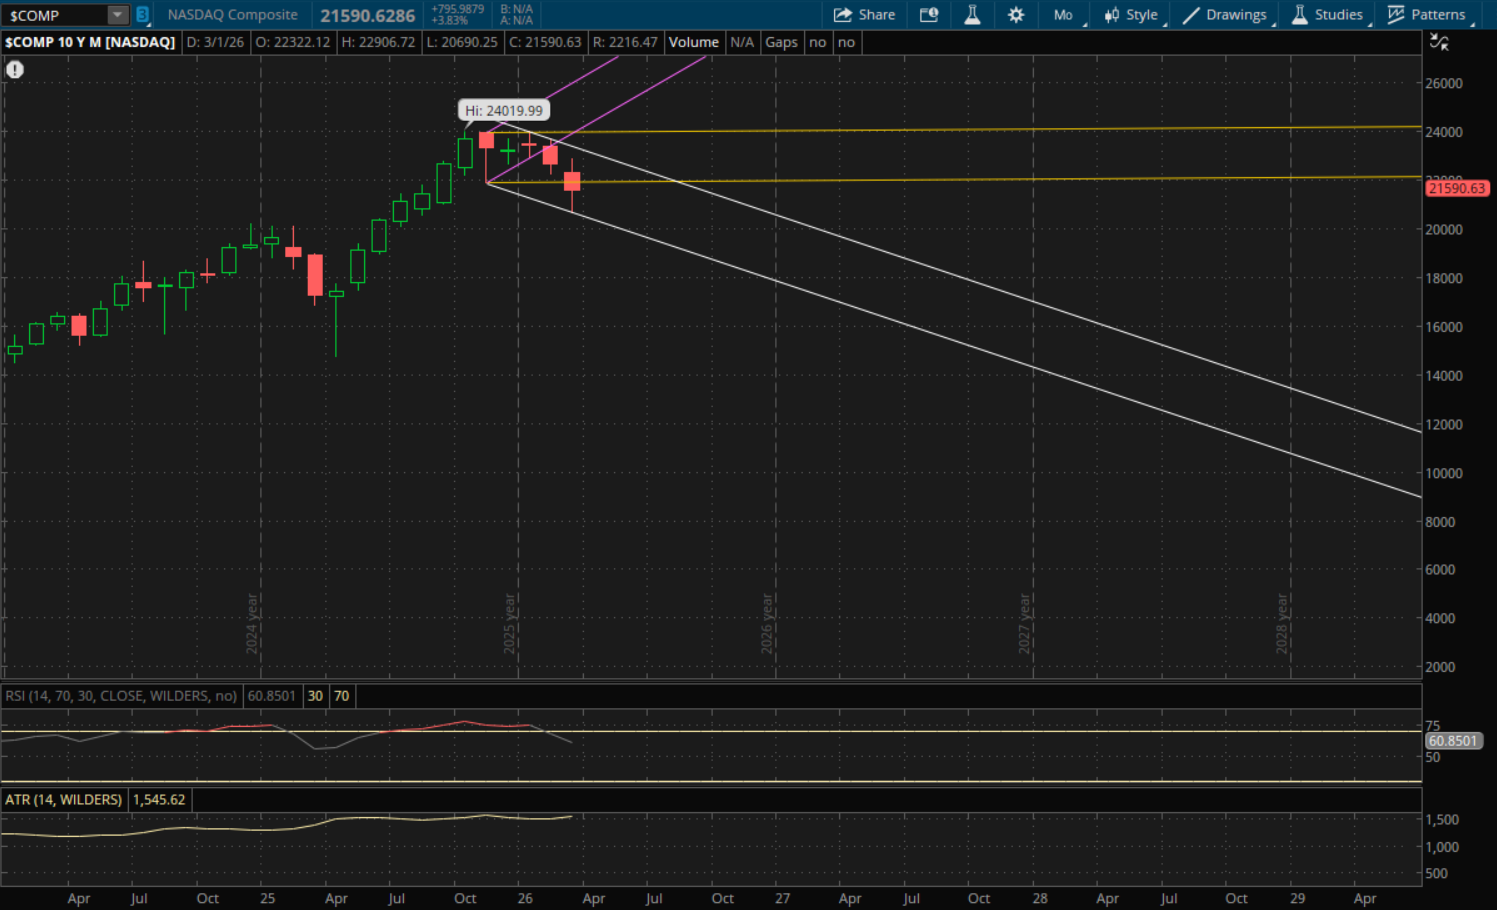
There was a lot of technical damage done with this sell-off over the past month and since today was also the end of the quarter, I'm going to look at quarterly charts as well. Starting with the Nasdaq, for the month it closed below its prior sideways support (last month's primary trend) which started a new monthly downtrend for it heading into April. Support from this new downtrend will be right around 20,400 in April which is another 5.5% away if its tested. For now this is the only support level to watch. On a bounce, the first resistance to watch will be from its prior sideways channel (yellow) that it closed below today. That level will be at about 21,935 for April which is only about 1.6% away. If it breaks through this level, then the next big resistance to watch will be from its new primary downtrend (white) at 23,100 which is about 7% away.
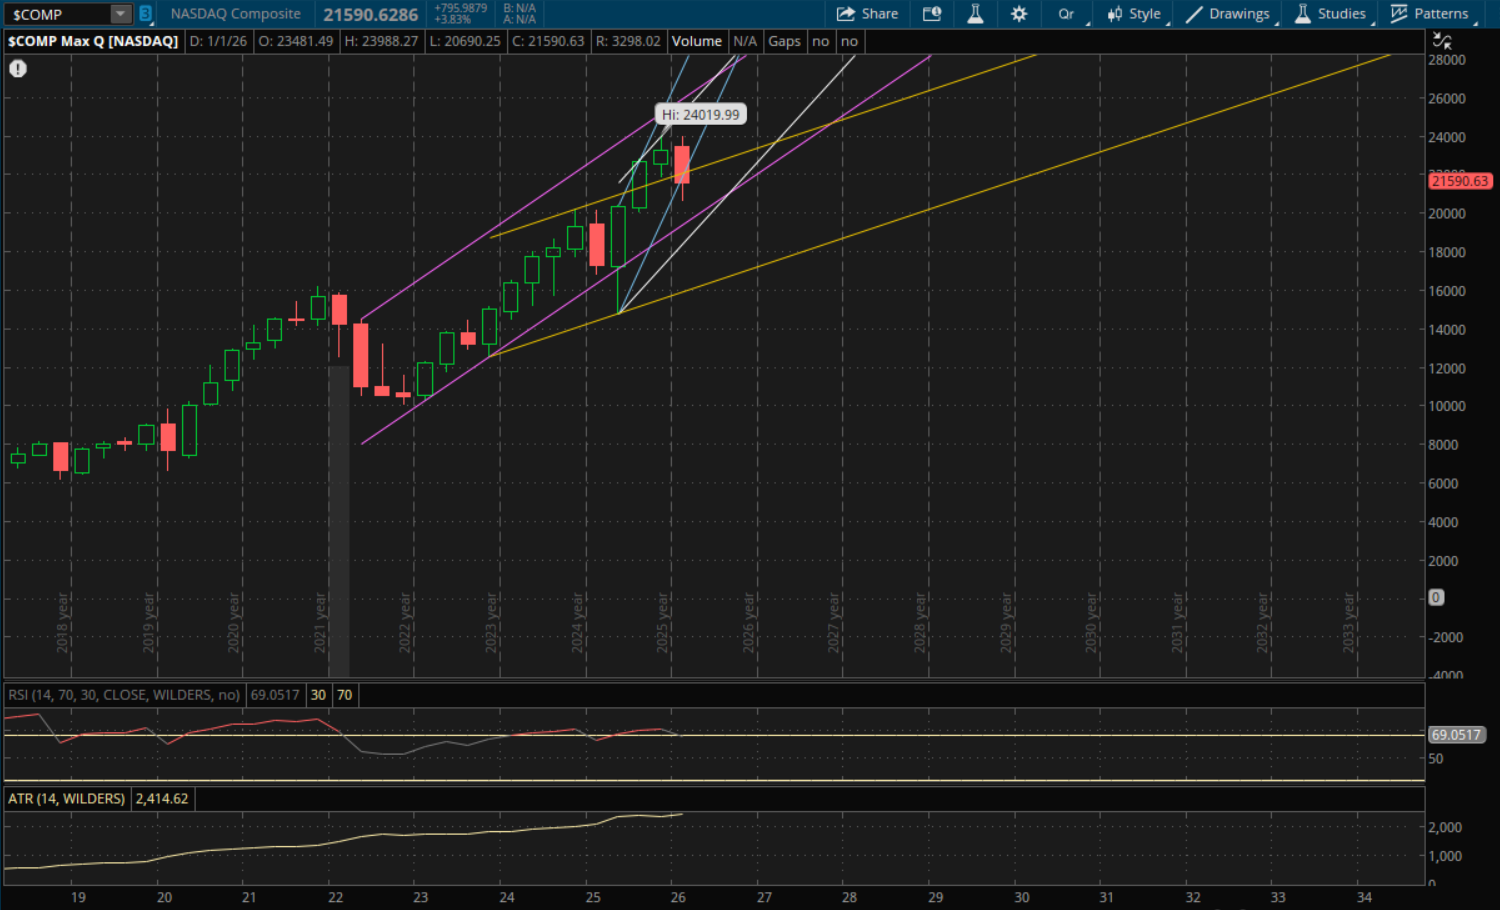
On a quarterly time frame, the Nasdaq closed below last quarter's primary uptrend (blue), but it still starts a new uptrend. There are a few levels to look at here, and the first one is resistance from its prior uptrend (yellow) at about 22,450 on a continued bounce. This level is about 4% away. If it breaks through it and resumes the rally, then the next level to watch would be from its next uptrend (blue) which it closed below today. That resistance would be at about 24,350 which would be new all time highs for it.
If we do get a continued sell-off then the next big support to watch will be from its prior uptrend (purple) at 20,150. After that, its new primary uptrend (white) will be at about 19,650. I think this is the ultimate target for a downside move and a real bottom and if we do get there it would be where I would be looking to buy. That primary support is at about 9% away.
The S&P broke and closed below last month's primary downtrend which starts another monthly downtrend for it into April. Its new primary downtrend (white) will be at about 6,225 which is another 4.6% away. For now that's the only monthly support to watch. On a rally, the next resistance to watch will be from its prior downtrend (yellow) at 6,750 and then its primary downtrend comes back into play again at 6,800-6,810.
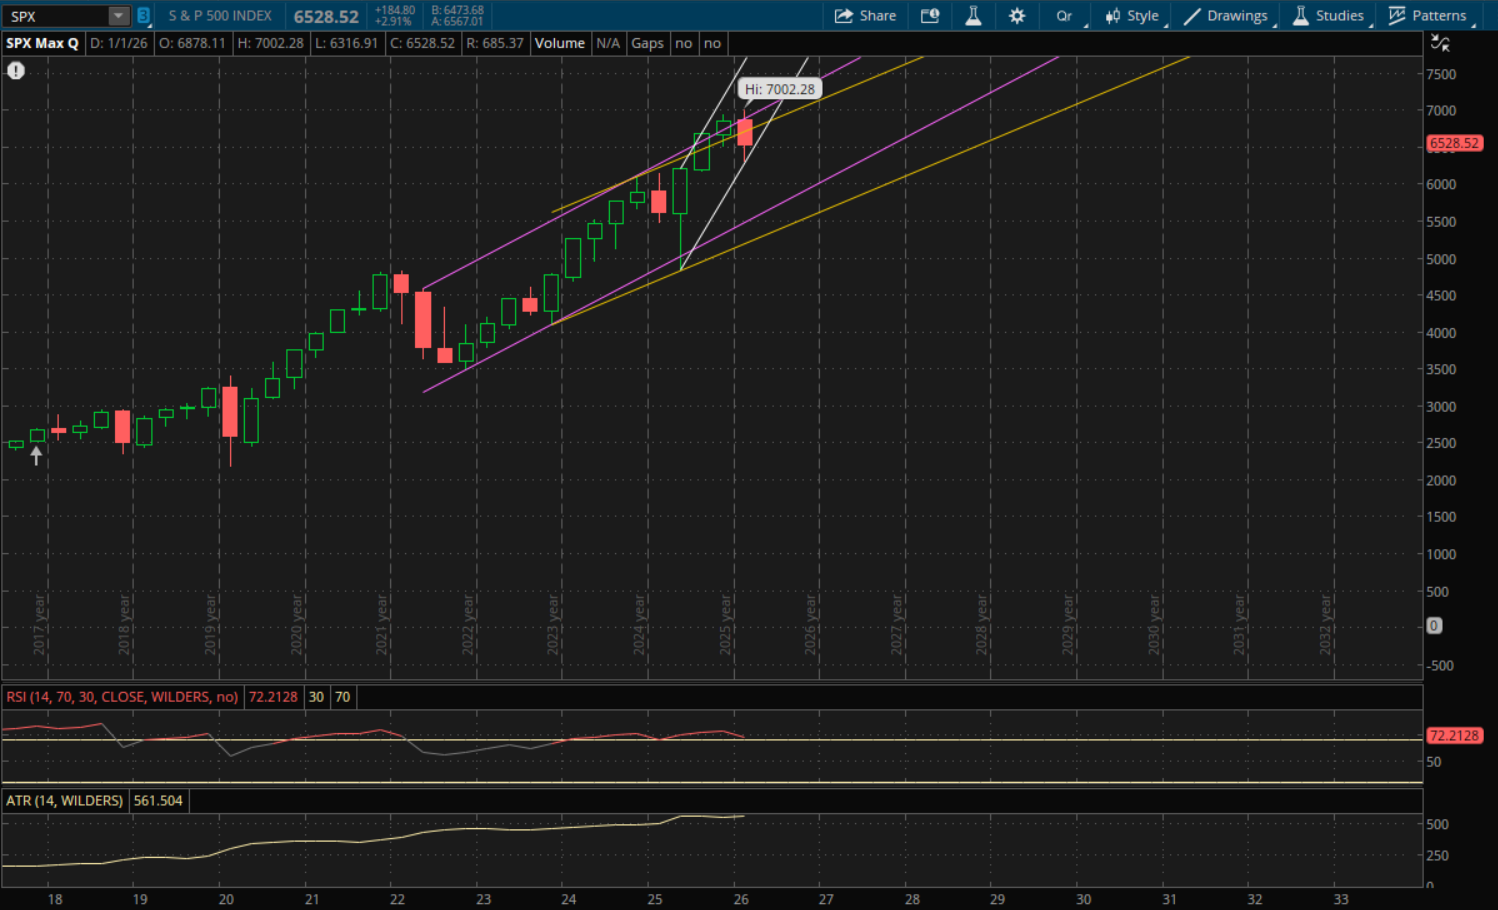
On a quarterly level, the S&P did not break through its primary uptrend. It got very close, but it ended up holding yesterday. However, due to the weak finish it will open below this uptrend to start April which will be at 6,775. That will be the first resistance to watch on a rally which is around 3.8% away. After that, its prior uptrend (yellow) will be resistance at about 6,835 and then its next uptrend (purple) will be at about 7,050 which is new all time highs.
If the sell-off continues, the next big support to watch will be at 5,640 from its prior uptrend (purple). This level is very far, about 13.5% away. That would be nearly a 20% sell-off from the all time highs which would nearly put the S&P in bear market territory if we were to get there. And below that, there would be more support from its next uptrend (yellow) at about 5,325 which is about 18% away.
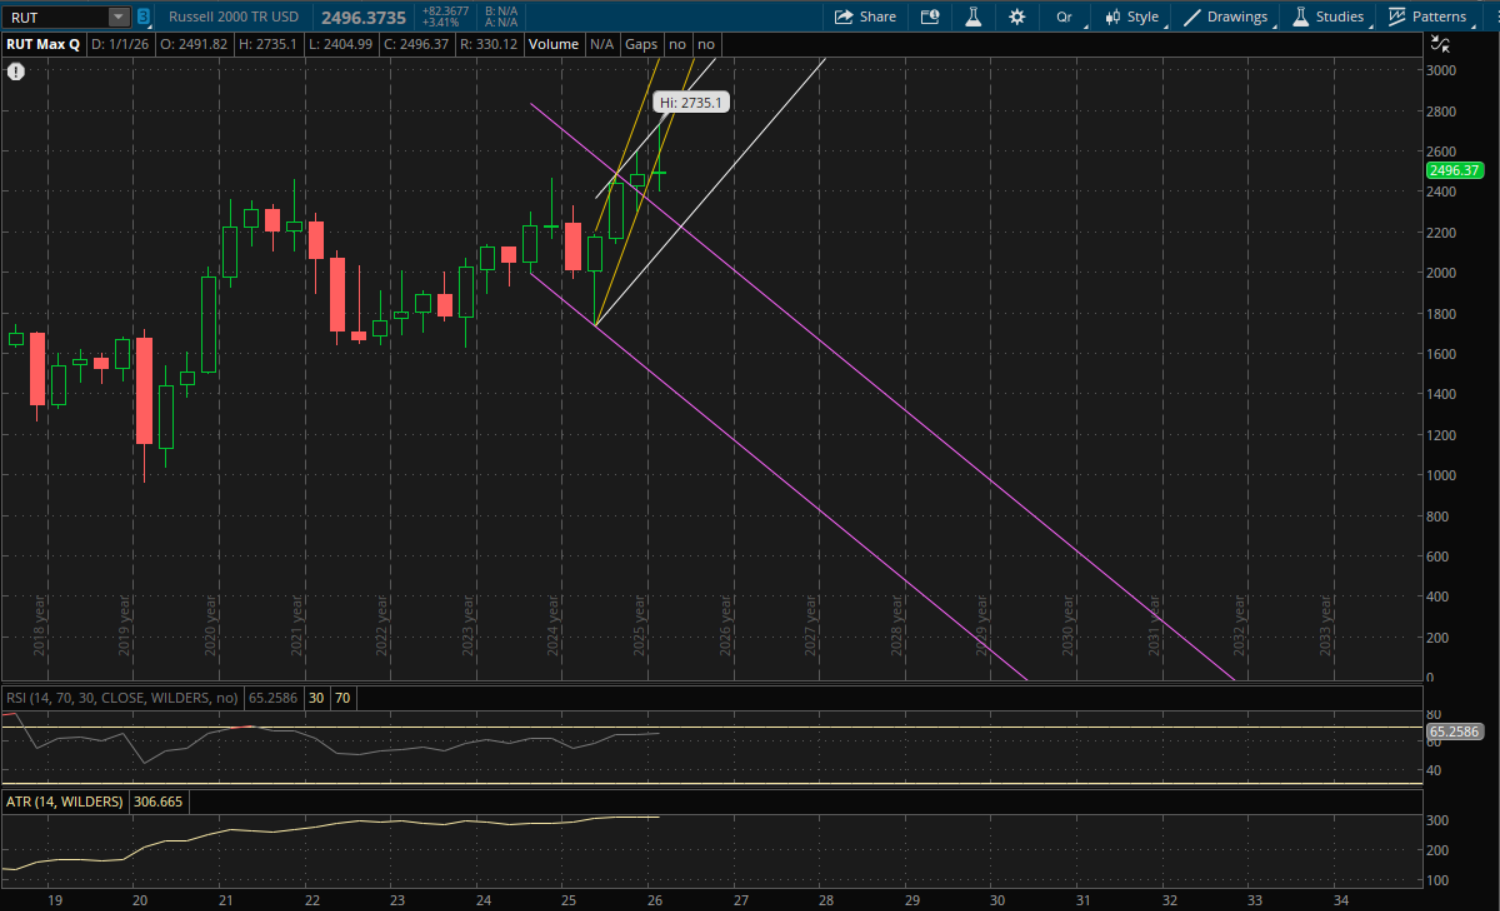
The Russell 2000 for the month closed below its prior uptrend which now starts its first monthly downtrend for it, and it's a very wide range. The first levels to watch on a bounce will be its prior uptrends at 2,572 (purple) and 2,612 (yellow). After that, its new primary downtrend (white) would be resistance at 2,650. On a continued sell-off, the next support to watch would be at about 2,160 for April, however this is 13.5% away and it's unlikely to get there next month. It's a big range and it could take a couple of months to get there if it does make a run at it. For May that support would be a little lower around 2,130.
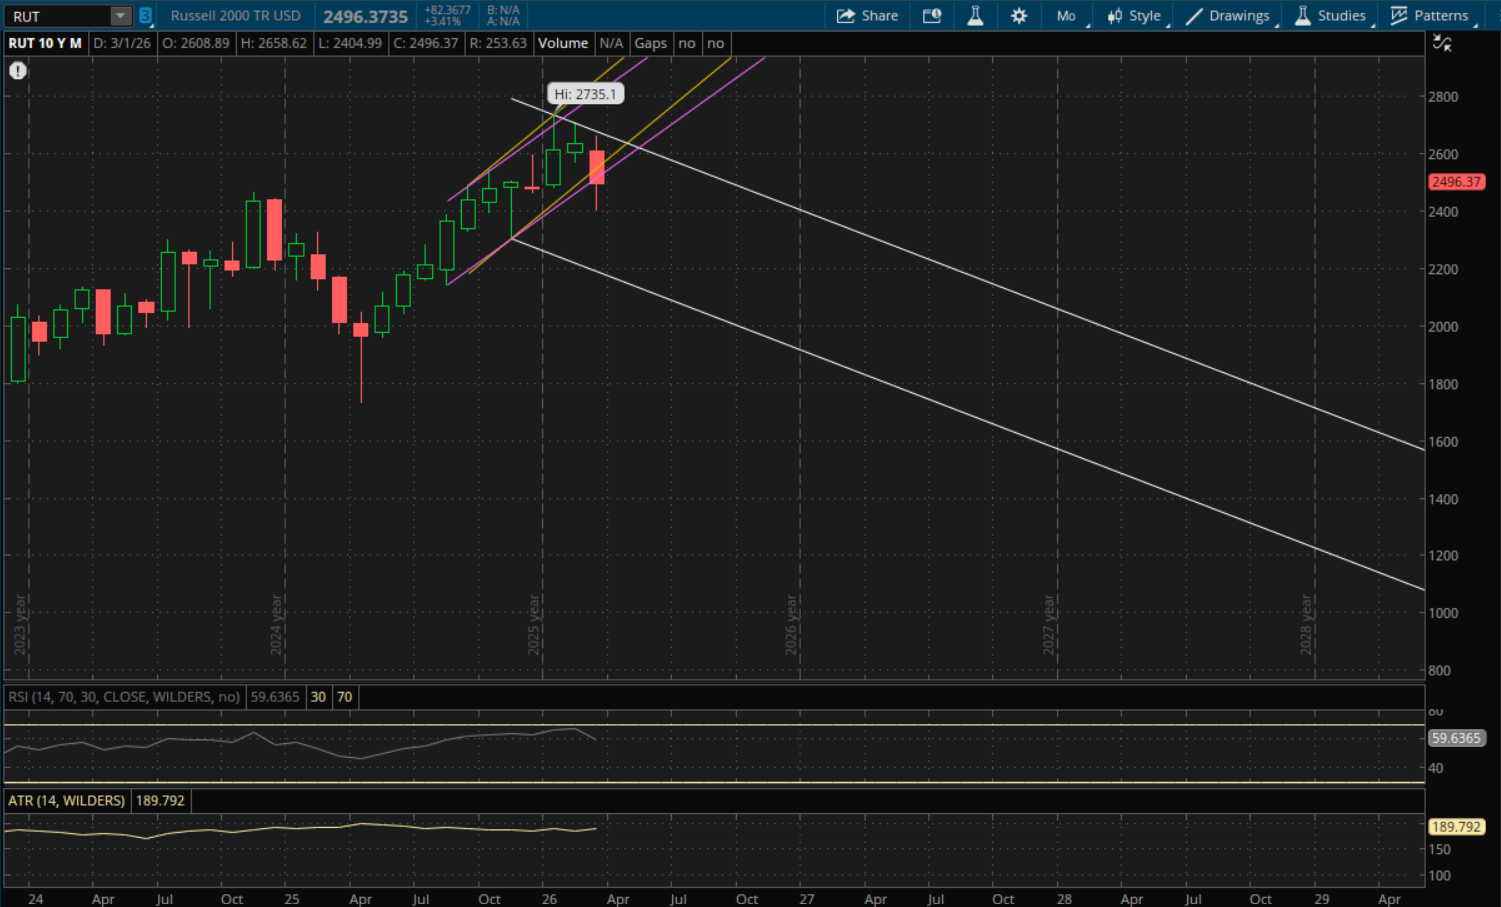
On a quarterly time frame, the Russell closed below its prior uptrend, but still starts a new uptrend going into the 2nd quarter. If the sell-off continues, the next big support level to watch will be around 2,225-2,235 from both its new primary uptrend (white) and its prior downtrend (purple). This area is another 10-11% away and is somewhere I would look to buy if it were to get there. If the rally continues, then its next quarterly resistance will be from its primary uptrend (white) at 2,860 which is above the current all time highs. Its previous uptrend (yellow) would also be resistance at about 2,890.