Markets saw a continued bounce today with small caps leading the way as the Russell 2000 closed up 0.67% while the Nasdaq and S&P closed up 0.47% and 0.25%, respectively. But, similar to yesterday, the rally faded and markets closed well off of their highs of day. The VIX continued its pullback, falling another 4.85% today to finish at $22.37. It's still elevated, though it is well off of last week's high when it breached $35. Tomorrow we will get the next FOMC rate decision at 2:00 PM Eastern followed by Jerome Powell's presser at 2:30 PM. There is currently a 99% chance of there being no change in rates announced tomorrow so we shouldn't be in for any surprises. The market however will be interested in what Powell has to say in his presser. Over the past month or so the odds of future rate cuts have been pushed back to late 2026 - early 2027.
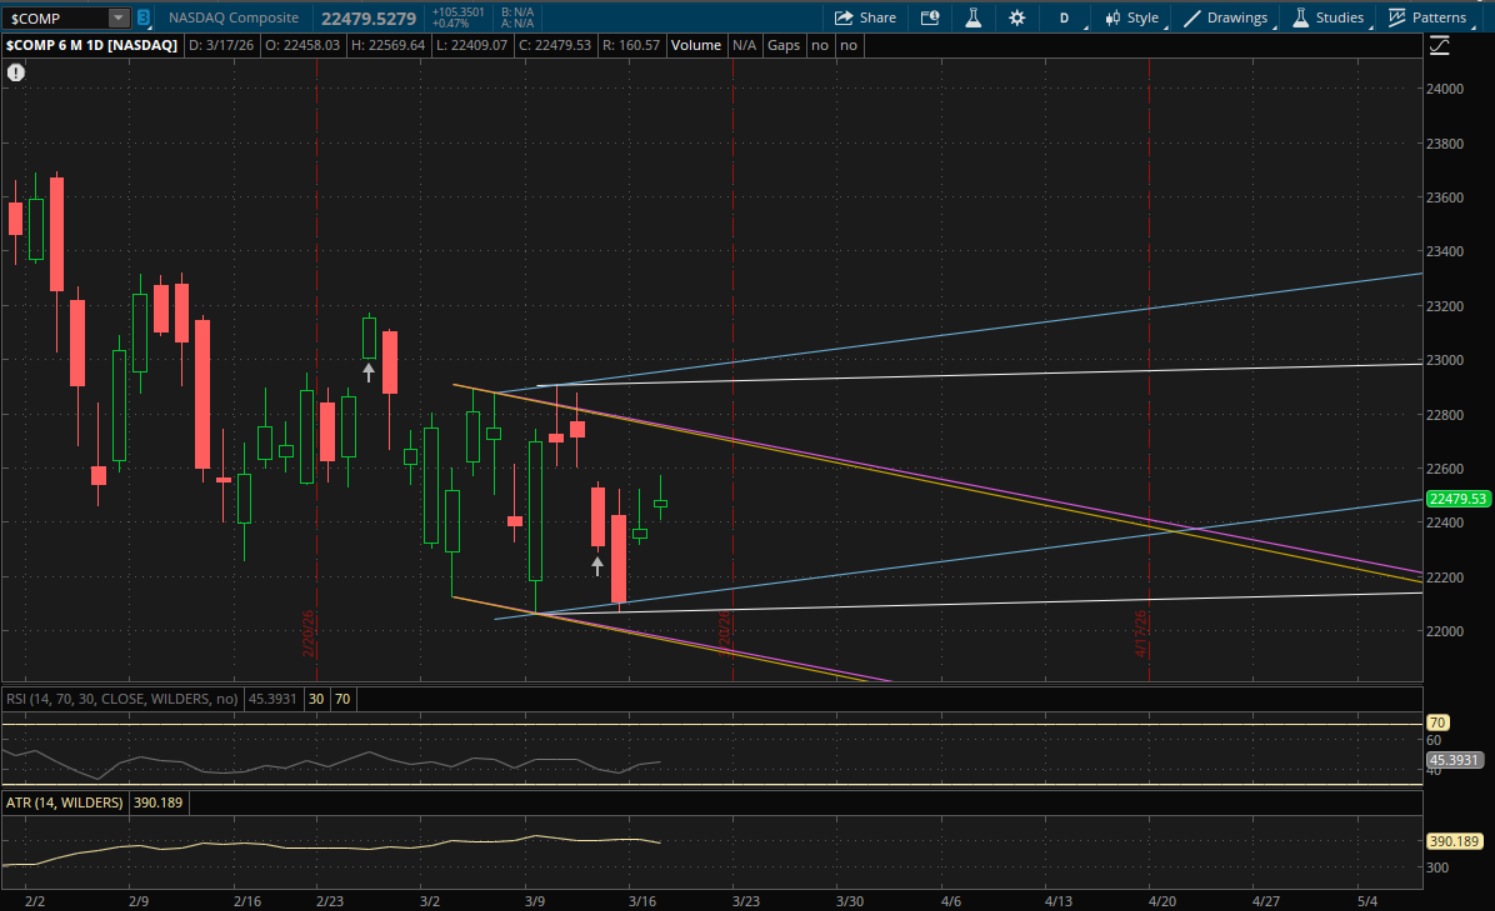
The Nasdaq is still in its big daily range and once again it didn't break through any support or resistances so all of its prior trends remain the same again. The first resistance levels to watch will now be at 22,735-22,745 from both of its prior downtrends (yellow and purple). If there's a big breakout above these, its primary range (white) would be the next level to watch at 22,920. The last daily resistance would be from its prior uptrend (blue) at 22,965.
If we get another sell-off then the next support level to watch will be from that same prior uptrend (blue) at 22,130 followed by its primary trend (white) at 22,075. If it breaks through its primary support then it will start a new trend, and we'll need to see how it closes to determine the direction. But its prior downtrends (purple and yellow) would also be support below that at 21,950-21,960.
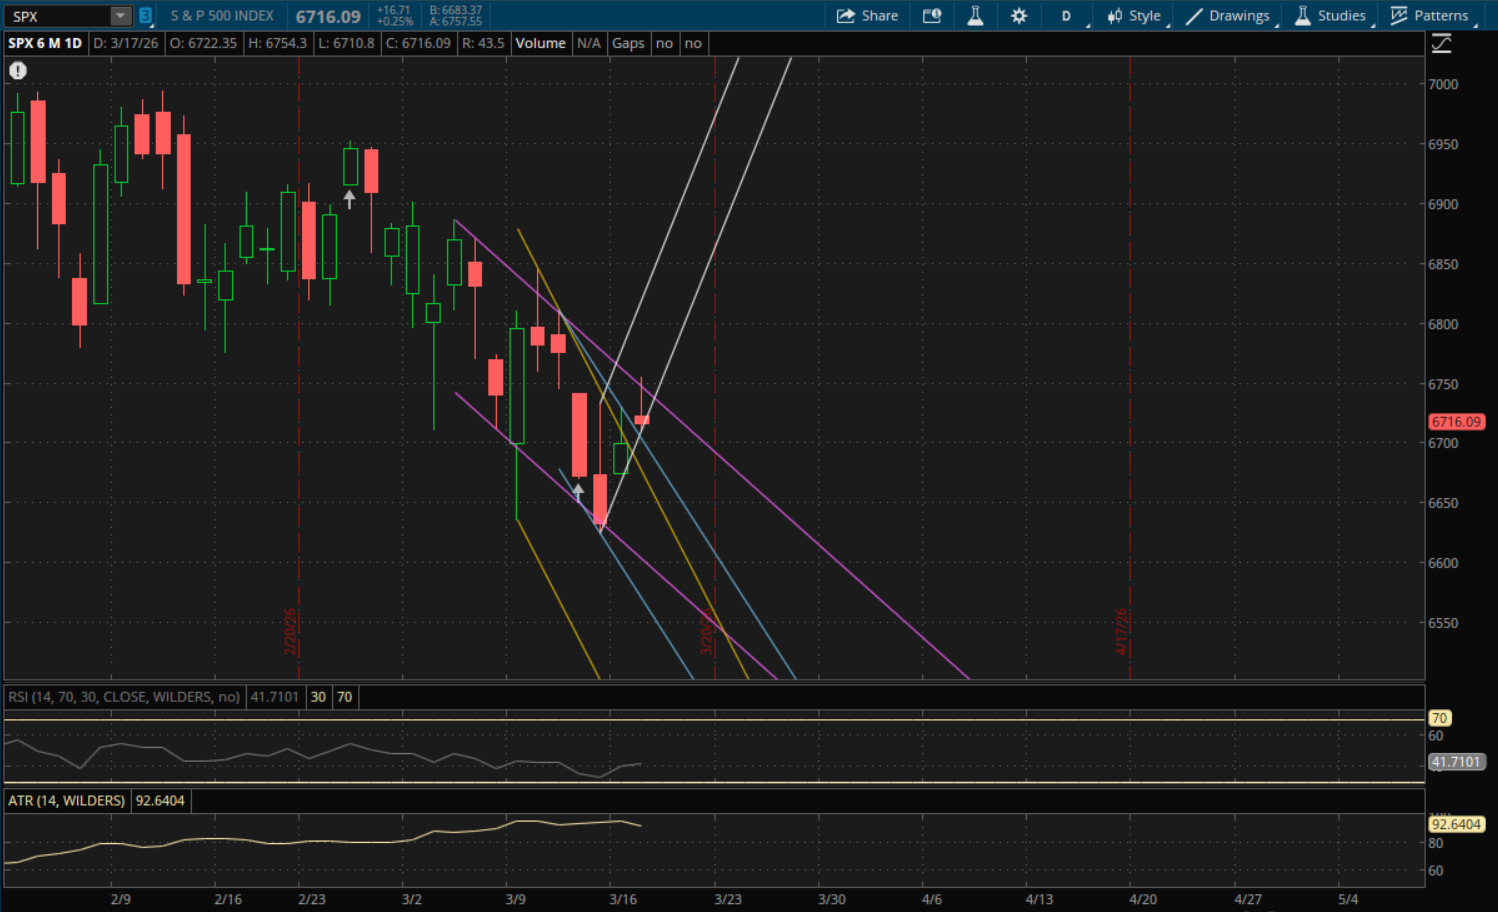
The S&P broke and closed above its prior daily downtrend from yesterday's update which started a new uptrend for it, but it was a really weak finish near the lows of the day and odds are it will open below this new uptrend (white) tomorrow which will be at about 6,755. It closed today at 6,716, so it's about 0.6% away. If it does not get that gap above it, then the 6,755 area would be resistance on a rally attempt. However, if it can gap above it or rally and break through it, then the next resistance would be pretty far at about 6,860-6,865 in the event of a big rally. Its prior downtrend (purple) will also be resistance at about 6,730 which is closer to today's close and it could potentially gap above this in which case it would become support.
On a pullback, the next support to watch will be at 6,675 from its prior downtrend (blue). If that does not hold, then its next downtrend (yellow) would be support at 6,640 followed by the bottom end of its next downtrend (purple) at 6,585-6,590.
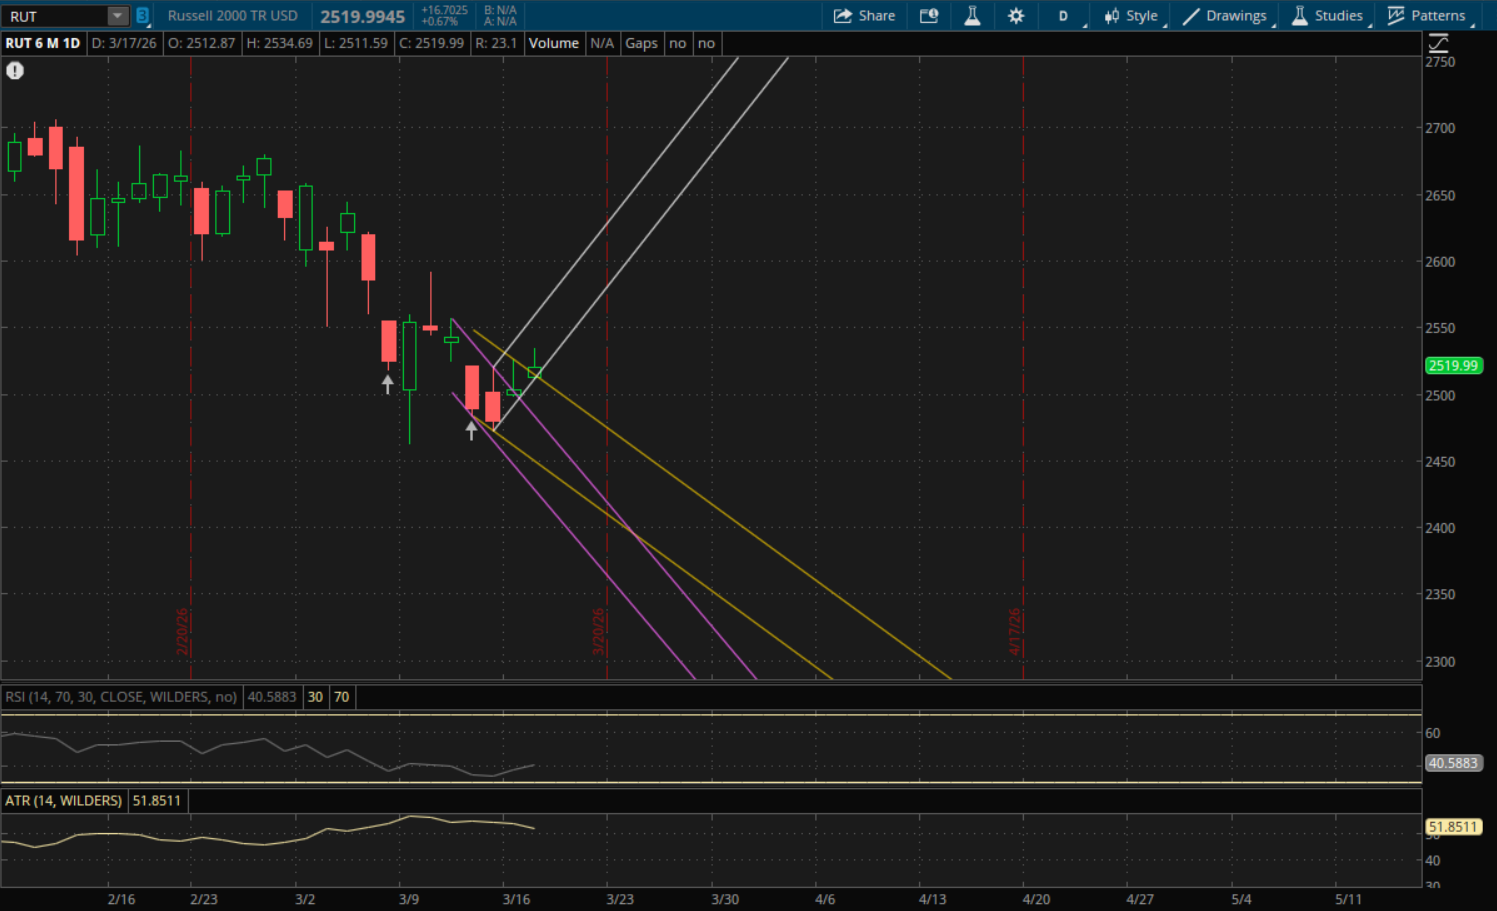
The Russell 2000 also broke and closed above its prior downtrend, starting a new uptrend. However it also wasn't a strong enough finish, though it wasn't as weak as the S&P's, odds are it opens below this uptrend tomorrow which will be at about 2,531. It closed at almost 2,520 today so it wouldn't require as big of a gap up to open above it - about 0.4%. But, assuming it does not get that gap up then the 2,531 level will be resistance. If it can do it, then that area will act as support and the next resistance would be much further away from the top of this new primary uptrend (white) at about 2,580.
In the scenario it opens below the 2,531 level and pulls back, the next support to watch will be from its prior downtrend (yellow) at 2,502 and if that does not hold then its next downtrend (purple) would be support at 2,465. In the event of a big sell-off its yellow downtrend would come back into play again at the bottom of that range which would be support again at 2,438.