This week is going to be a short holiday trading week with the markets closed on Friday, June 19th, for the Juneteenth holiday. Even though it is a short week, there will be a big catalyst on Wednesday with the FOMC rate decision at 2:00 PM ET. The rate market is currently pricing in no change in rates with a near 100% chance, so nothing dramatic is expected with that. However this will be the first rate decision under new Fed Chair Kevin Warsh and he will also be holding his first press conference at 2:30 PM ET where he will likely discuss the current inflation and economic situation. The press conference will likely be a bigger market mover than the actual rate decision itself - assuming there are no surprises with that. Aside from this, the potential peace deal between Iran and the U.S. remains in focus with mixed reports over the weekend of a potential deal being signed soon.
Last week the markets did bounce back and small caps were the standout winner with the Russell 2000 closing up 3.8% for the week. The Nasdaq and S&P also finished higher after starting the week lower, but their gains were relatively muted as they both closed higher by about 0.65%. The VIX had a sharp reversal for the week, closing down nearly 18% after having been up 8.5%.
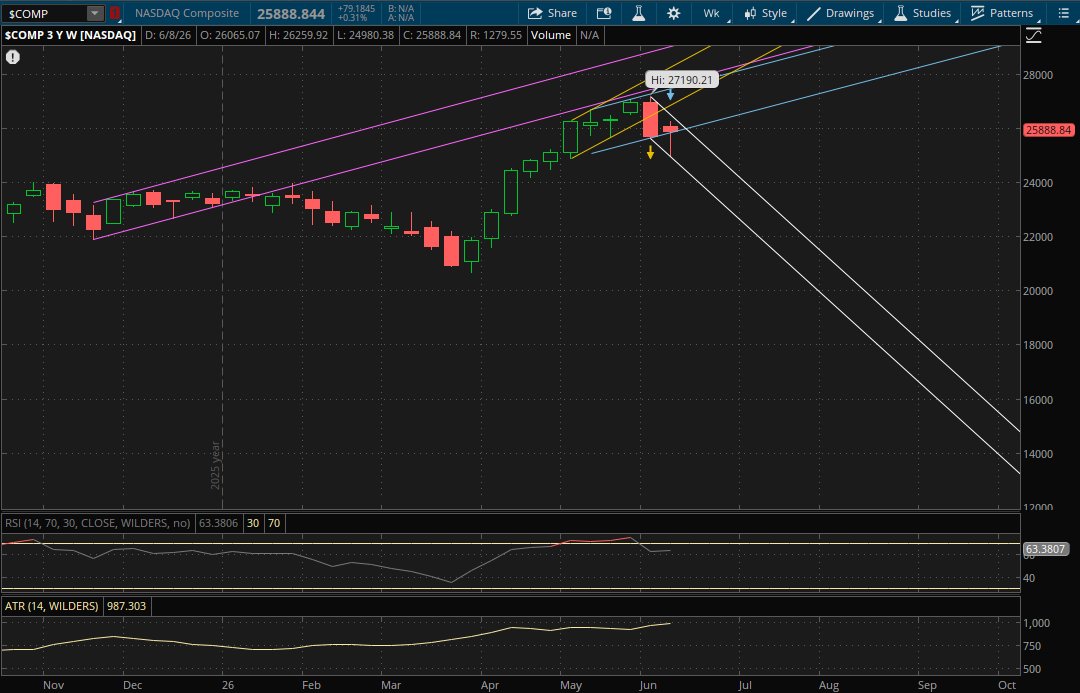
The Nasdaq did break below its last weekly uptrend, but it did close back over it so this is technically a failed weekly breakdown. However, since it made a lower low, it still starts a new downtrend. The key now is how it opens tomorrow. Its new primary downtrend (white) will be around 25,860 which is just below last week's close of 25,888. If it can open above the 25,860 level, that area will act as support on a pullback again. The next resistance from there will be at about 26,035 from its prior uptrend (blue). If it can potentially gap above this level as well, then that would also act as support on a pullback. From there, on a continued rally the next resistance to watch would be around 27,275 from its prior uptrend (yellow) which would be new all time highs for it.
If the Nasdaq fails to open above its new primary downtrend around 25,860, or if it opens above it then breaks through it again, the only other support would be from this same downtrend (bottom of the range) at about 24,315.
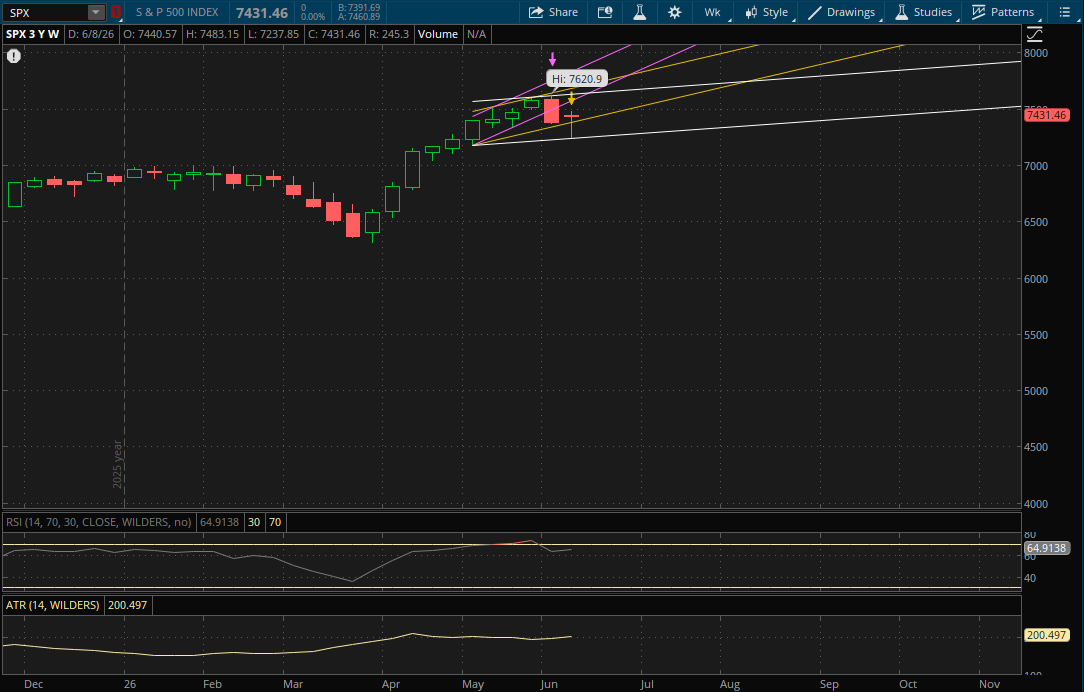
The S&P also had a failed breakdown, but it starts a slight uptrend now (essentially sideways). The first level to watch will be from the retest of last week's failed breakdown (yellow) at 7,421-7,422. This is just under last week's close of 7,431. So as long as it doesn't gap below that 7,421-7,422 area it will act as support on a pullback. From there, the next resistance level will be at 7,647 from its new primary range (white) followed by its prior uptrend (purple) which is just above that at about 7,655. These would be new all time highs for it.
If the S&P fails to open above its retest support (yellow) at 7,421-7,422 then that level will act as resistance on a retest. If it does open above it, but breaks through it, then the only other support on a continued pullback would be from its primary uptrend (white - bottom of the range) at 7,250-7,255.
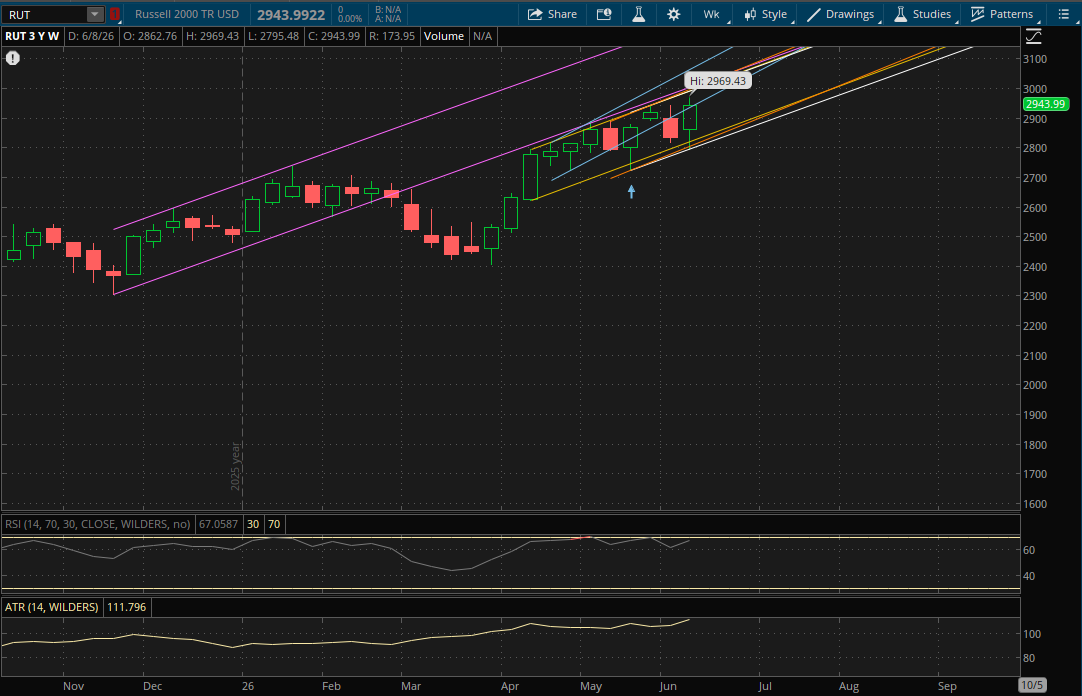
The Russell 2000 had a failed breakdown as well and made a new all time high last week, which starts a new uptrend for it. It will have several resistances overhead as all of its prior trends remain valid. The first will be from its blue uptrend at about 2,973. If it can break through that, then it will have more resistance at 3,015 (white), 3,017 (yellow), 3,025 (orange), and 3,030 (purple).
On a pullback, there will also be several supports to watch. The first being at about 2,845 from its prior uptrend (yellow). Then the retest of last week's failed breakdown (orange) will be at about 2,830. Its last support will be from its new primary uptrend (white) at about 2,820.