The markets were much calmer today and finished relatively flat with the Nasdaq closing virtually unchanged, up 0.01% while the Russell 2000 and S&P 500 fell 0.22% and 0.21%, respectively. They were higher most of the day but there was a headline in the afternoon that Iran was taking steps to deploy mines in the Strait of Hormuz which sent markets lower and oil higher a bit. However, oil still closed the session down 8.84%. During the market rally the VIX was down over 10%, but with the late day pullback in the markets it only closed down 2.24%. Tomorrow morning we will be getting month over month CPI data which will give us some more insight into the inflation front.
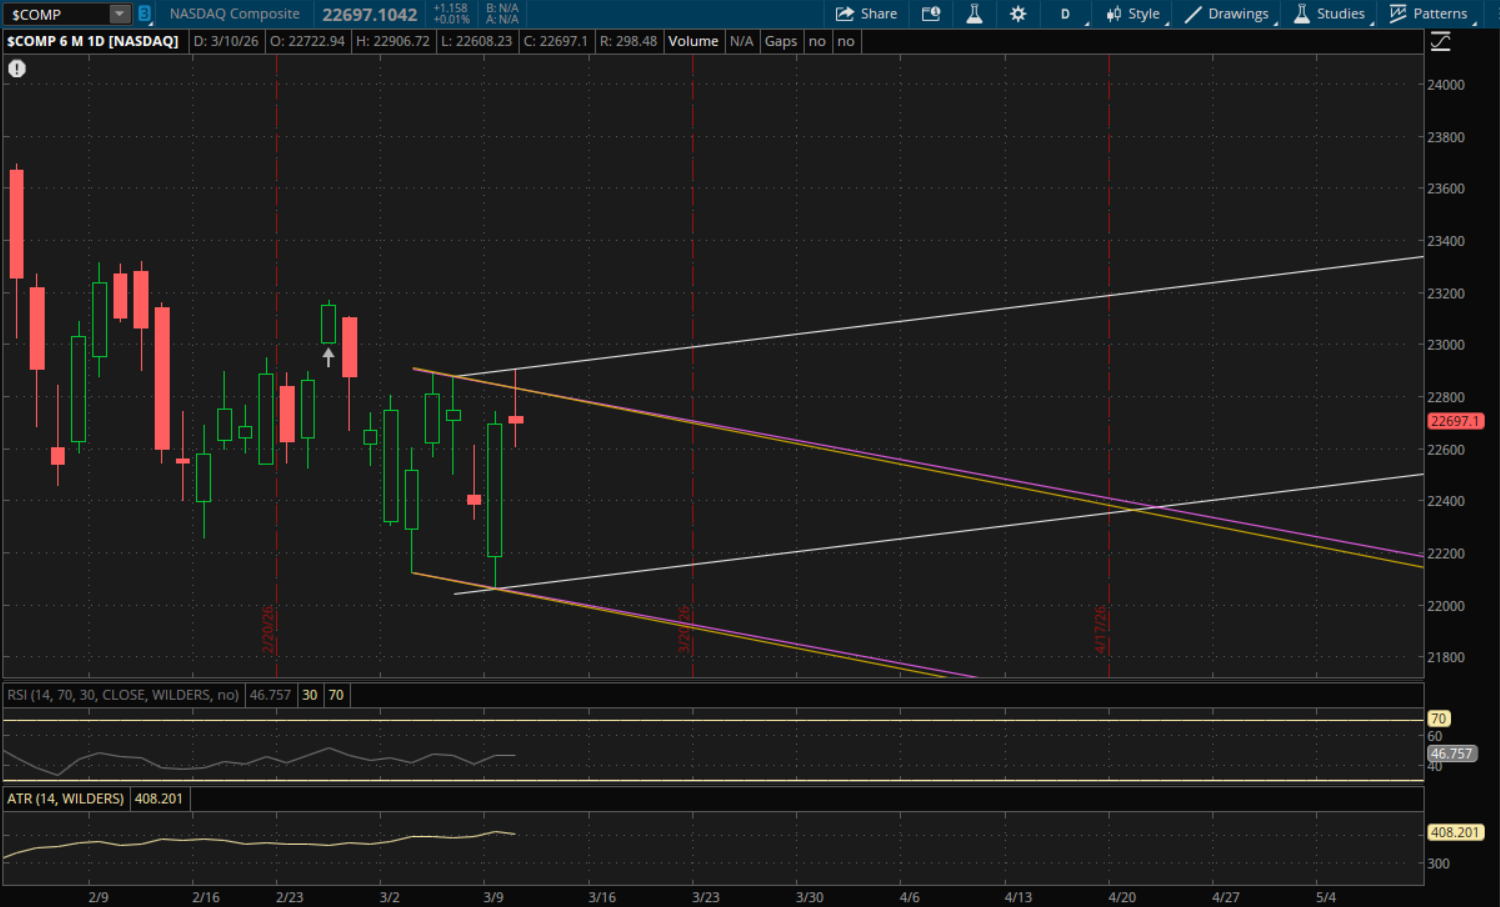
With today's late day reversal in the markets the Nasdaq did have a failed breakout on daily time frames. The silver lining here is that it did make a higher high which starts a new uptrend for it. It also did break above weekly resistance today, but we'll need to see whether it can close above it or not by the end of the week. For tomorrow's levels, the first area to watch will be at 22,810-22,820 from both its prior downtrends (purple and yellow) that it failed to close above today. This would be a retest of that failed breakout. If it can break through them, or potentially even gap above them since we do have the CPI data tomorrow, then the next resistance would be at 22,915 from its new primary uptrend (white) that it started today. And if we were to see a big gap above that level as well, then that area would be support on a pullback. If we do get another sell-off then the next big support to watch is also from this new uptrend (white) at about 22,080.
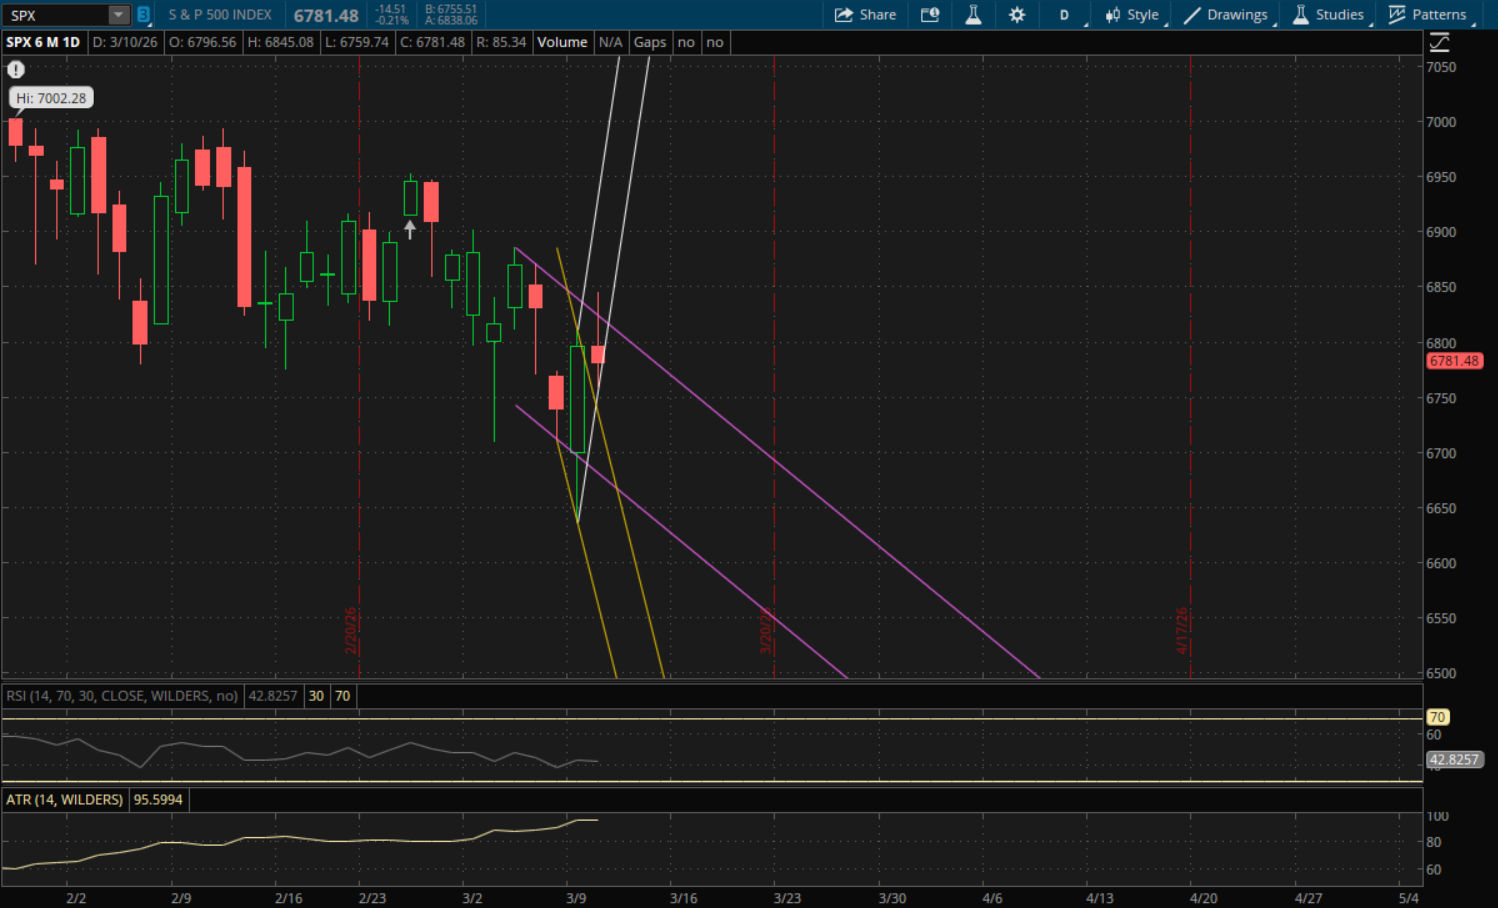
The S&P closed above its daily downtrend which also starts a new uptrend for it, but it wasn't a strong finish and it would need to have a significant gap up tomorrow to stay in this new uptrend (white) which will be at about 6,880. This is about 1.5% away from where it closed today so it's very unlikely, though with CPI in the morning anything is possible. On the off chance that it does gap above it, then that level would be support. The next level to watch would be at about 6,808 from its prior downtrend (purple) which it could potentially gap above as it's much closer. If it can, then that area will be support as well. Otherwise, it will remain as resistance and then the next support to watch on a pullback would be at about 6,665 from this same trend (bottom end of it). There would also be more support just below that at about 6,660 from its downtrend (yellow) that it closed above today.
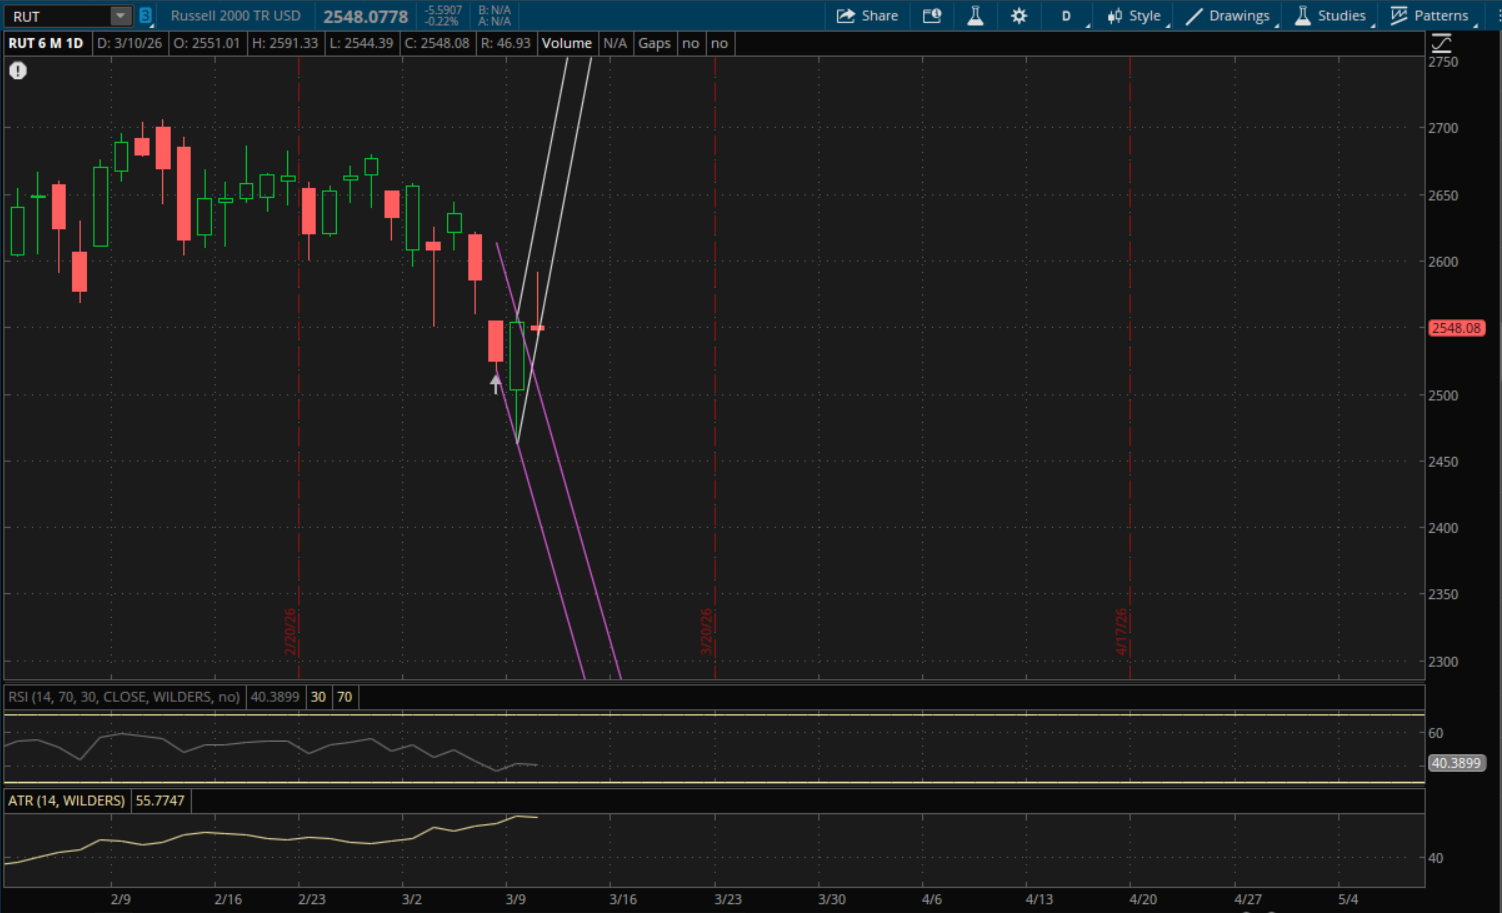
Similar to the S&P, the Russell 2000 closed above its previous downtrend to start a new uptrend. However, it was a very weak finish near the lows of day and it will be extremely unlikely to gap above its new uptrend (white) which will be at about 2,625 and is 3% away. That will be the key resistance level to watch tomorrow on a rally attempt, though it would be a big rally if it were to happen. On a pullback, the next support to watch will be at about 2,448 from its prior downtrend (purple).