The 10 year treasury yield jumped nearly 3% today to 4.6% which sparked a sell-off in equities. This was its highest level in nearly a year. Higher yields are particularly bad for small caps which were hit the hardest today as the Russell 2000 closed down 2.44% near the lows of day. A lot of the AI names and semiconductors took a step back as the SOXX fell over 4% while the Nasdaq closed down 1.54%. The S&P also lost 1.24% after closing above 7,500 yesterday for the first time. With today's sell-off, the VIX jumped 6.78% to close at $18.43, although it was off of its highs of day.
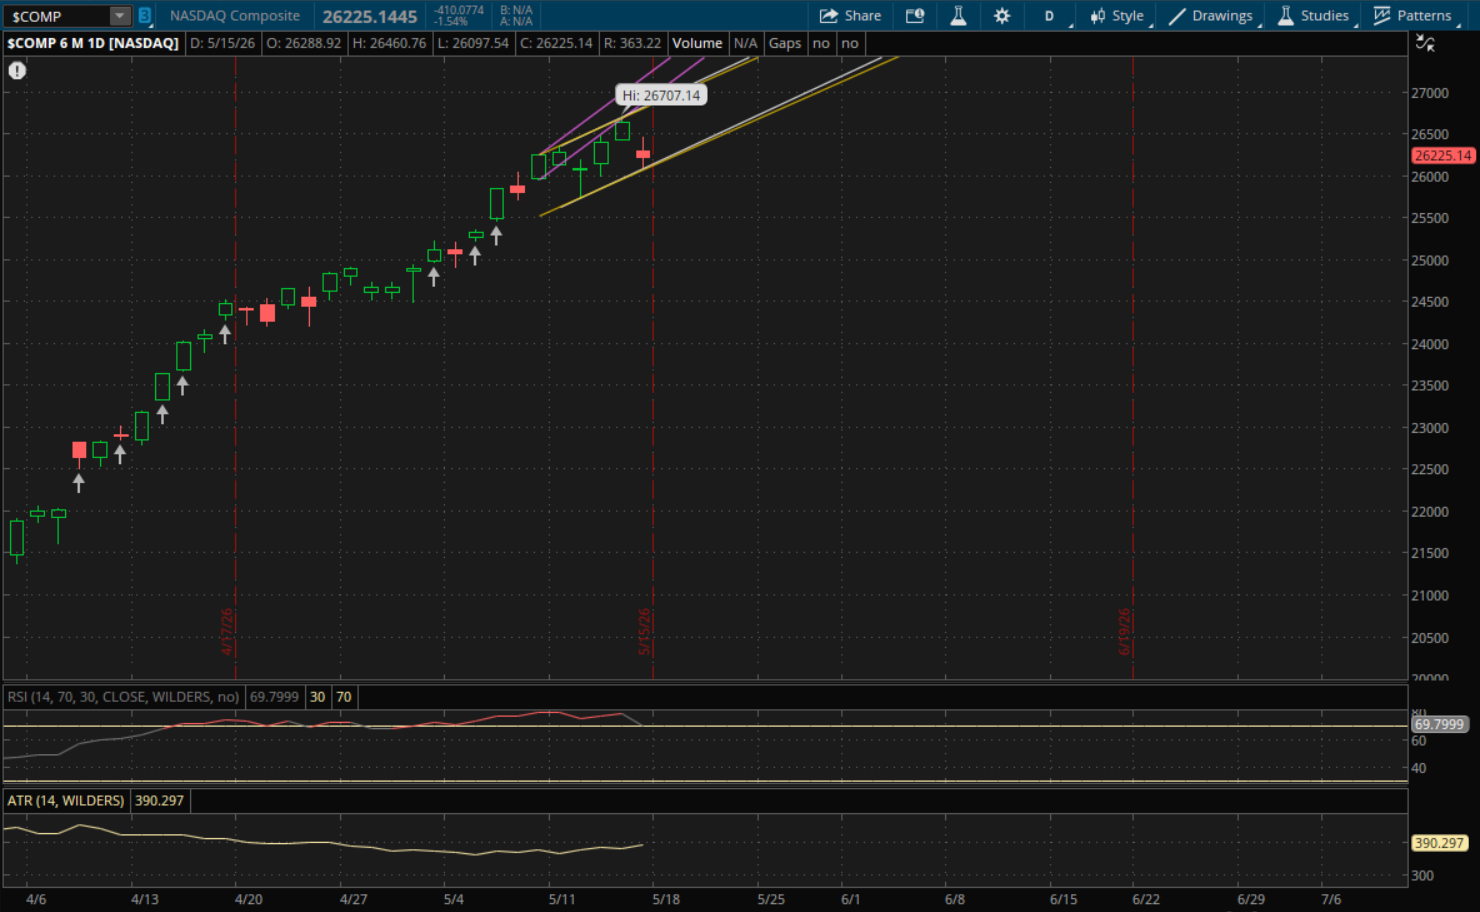
As I mentioned in yesterday's update, the markets were setting up for a pullback due to the failed breakouts on Thursday. The Nasdaq's first support that I noted in the update was around 26,090 for today and it hit a low of 26,097.54, just a hair off of it. It didn't break through its primary uptrend support today, so it doesn't start any new trends for Monday.
Its primary uptrend (white) will again be the first level to watch on Monday which will be at 26,200-26,210 just below today's finish of 26,225. Since it did close just above it, there is risk of a gap below it on Monday. If that happens, the 26,200-26,210 area would become resistance. Its last daily support will be just below that at 26,180-26,190 from its prior uptrend (yellow).
If the Nasdaq does open above its primary uptrend at 26,200-26,210, then this level will remain as support on a pullback. The next resistance level to watch will be from its prior uptrend ((yellow) at 26,910-26,920 and then its primary uptrend (white) will be resistance at 26,940-26,950. If it can break through those on a resumption of the rally, then its last daily resistance will be at its next uptrend (purple) at about 27,060.
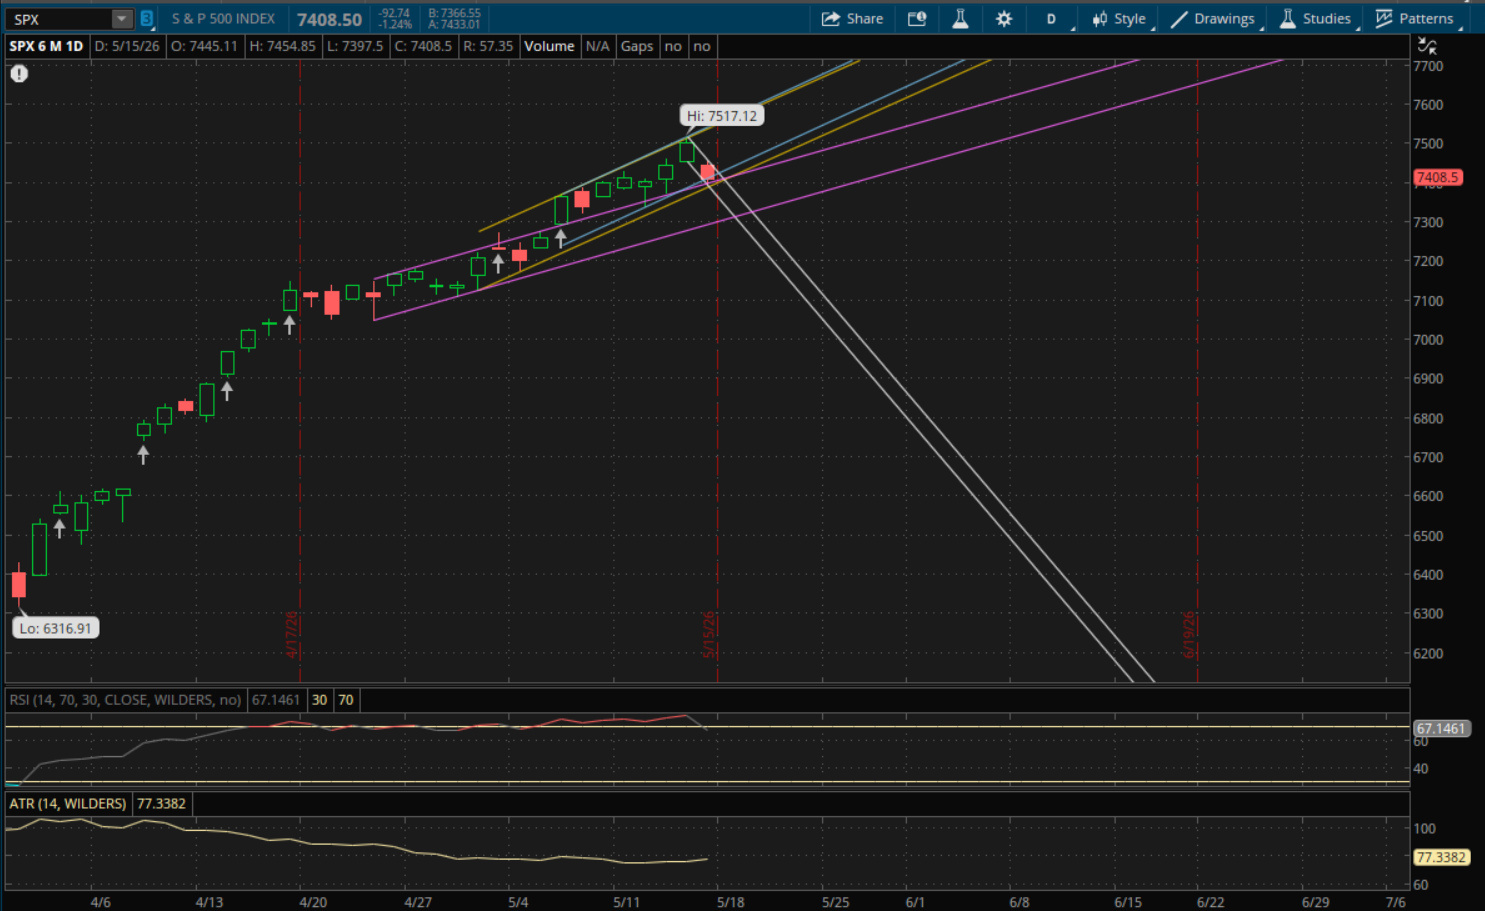
The S&P broke and closed just below its primary uptrend support today. This now starts a new daily downtrend for it going into Monday, but it will have to gap down in order for this new downtrend to be resistance. Its new primary downtrend (white) will be at about 7,390 on Monday which is below today's close of 7,408.50. So as long as it doesn't gap below 7,390 on Monday, that level will act as support on a pullback.
Its prior uptrends (purple and yellow) will both be resistances at about 7,415. Now it's also possible that we get a gap back above this level as it's only 0.1% away. If it opens above 7,415 on Monday then that level will also be support and the next resistance to watch will be from the next uptrend (blue) at 7,437-7,438. This last resistance is a little further away, about 0.4%, but it's also possible that it gets a gap above it in which case it would become support as well.
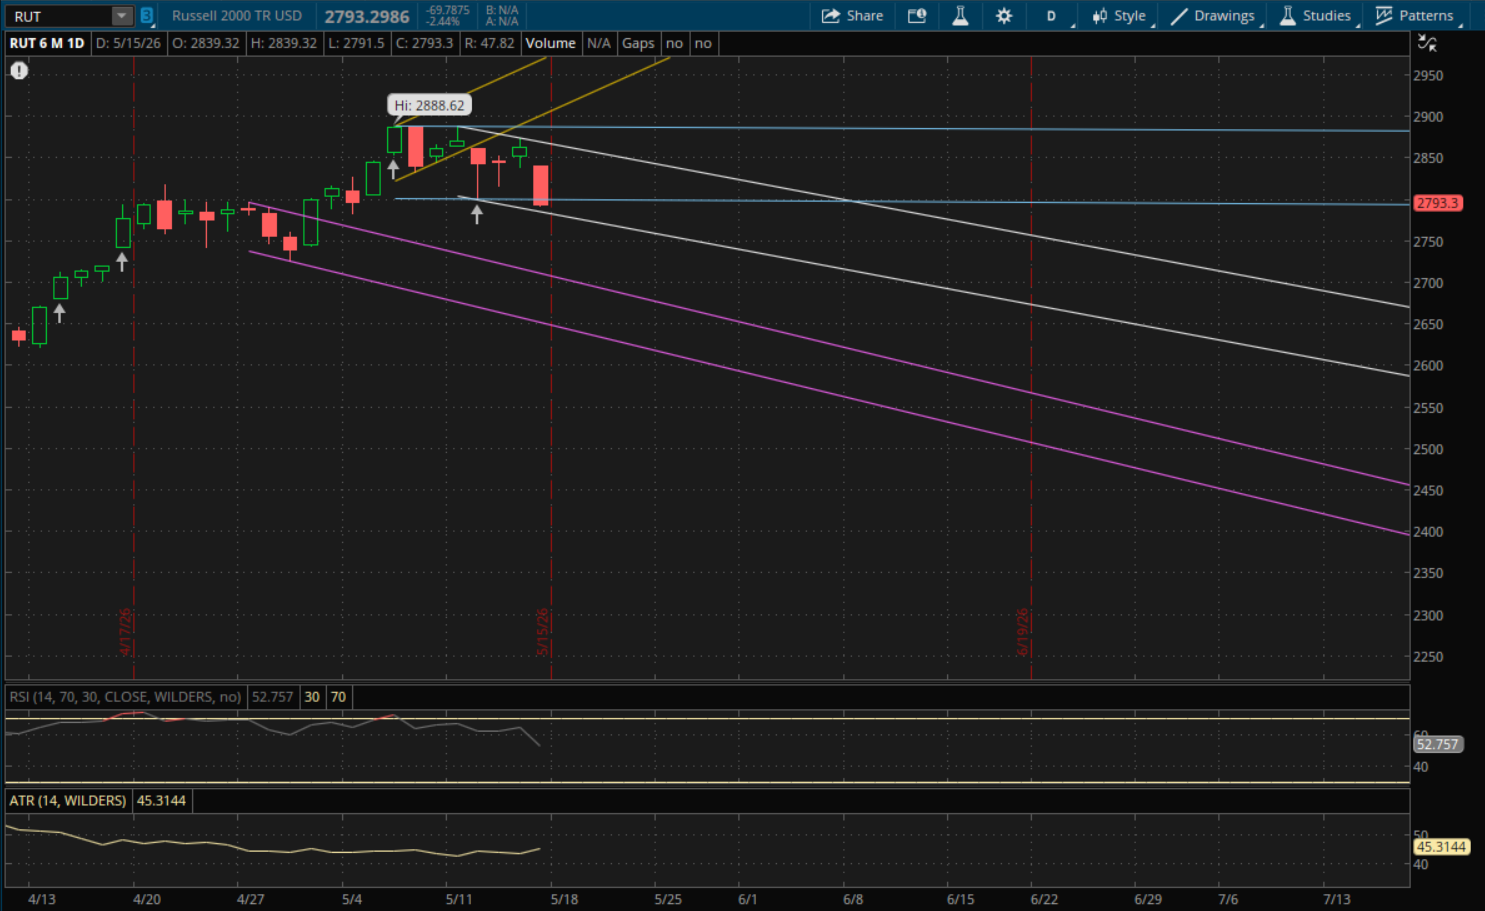
The Russell 2000, which was by far the worst performing today, broke and closed below its primary sideways range from yesterday at 2,799-2,800. This starts a new downtrend for it going into Monday's session. Its new primary downtrend (white) will be support at 2,780 on Monday. The Russell closed at 2,793 so if it were to gap below its new primary downtrend support at 2,780 then that would become resistance. After that, its last daily support would be from its prior downtrend (purple) at 2,705 if there's another big sell-off.
The first resistance to watch on Monday will be from the prior sideways range (blue) that it closed below today. That level remains at 2,799-2,800 which it could also potentially gap above. If it does gap back over that level on Monday, then it becomes support. The next resistance to watch would then be from its primary downtrend (white) at about 2,865 if we get a snap-back rally.