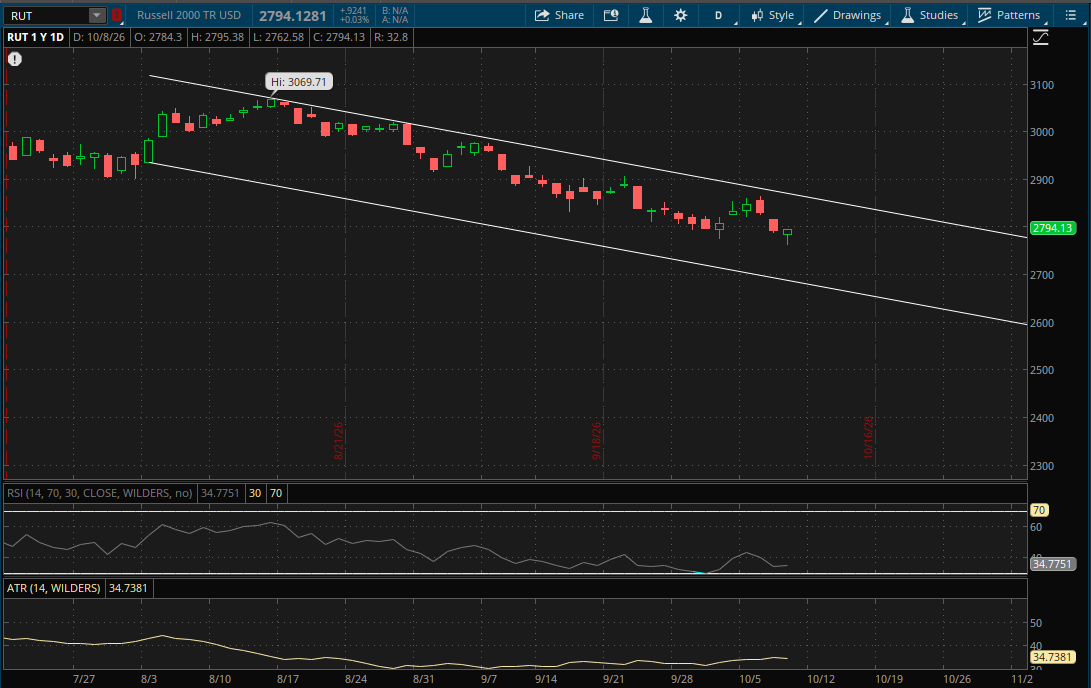
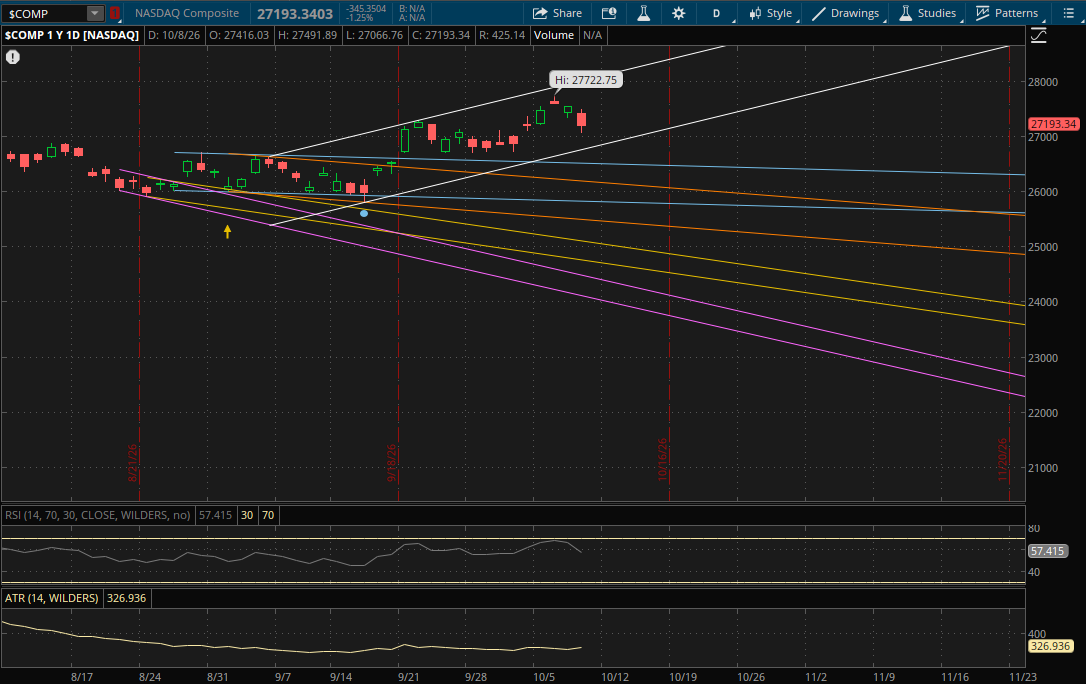
This afternoon there was a report that said OpenAI told investors it's annualized revenue rate (ARR) would be near $50B which was well short of the previously reported $70B number. This caused a broad sell-off in tech and specifically AI/semiconductor related names which took the Nasdaq down nearly 2% at the lows of day before it recovered some into the close to finish down 1.25%. When the news hit and the AI trade began to sell off, there was a rotation back into defensive laggards and small caps. The Russell 2000 went from underperforming to outperforming on the day, and finished slightly positive with a gain of 0.03% at the highs of day. The S&P posted a loss of 0.47% but did recover off of its lows. The VIX did jump over 9% at its highs of day, but faded once again and closed up just 2.20% at $15.41.
The Nasdaq is still trading in its big primary uptrend (white) with today's sell-off, but it's getting closer to that support now which could end up being tested tomorrow. But first we'll look at resistance and the only daily resistance to watch for tomorrow would be at the top of its primary uptrend around 28,075. This is over 3% away now and is unlikely to be tested after today's pullback.
A pullback towards the bottom end of this primary range is the more likely scenario now and that will be support around 26,825 for tomorrow which is only another 1.4% away. If it breaks through it, the next support to watch would be from its prior downtrend (blue) at 26,500-26,525.
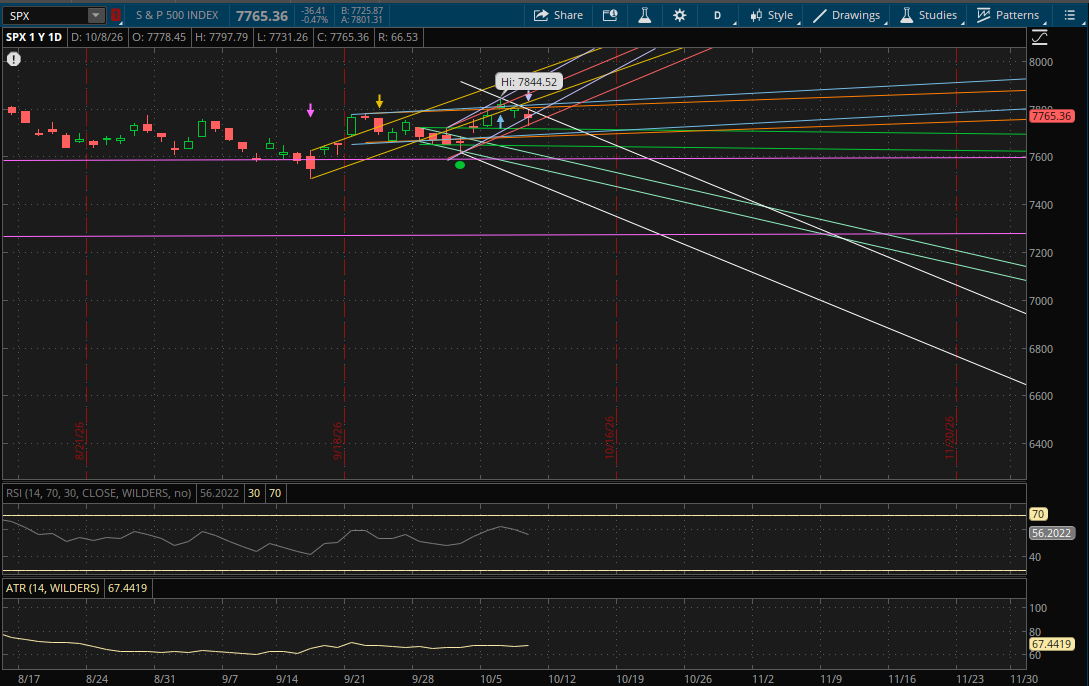
The S&P initially got a bounce at the 7,768-7,770 level which was support from the primary daily uptrend that it started yesterday. However it broke through it after the OpenAI news and closed just below it, starting a new primary downtrend (white) for tomorrow. This new primary downtrend will be the first resistance level to watch for tomorrow at about 7,774 which is just above today's close of 7,765.36. If it were to gap back up above the 7,774 level tomorrow then this primary downtrend would become support. From there on another rally attempt, the next resistance to watch would be at 7,800 (light purple) followed by 7,808-7,810 (orange) and finally 7,820-7,822 (blue). If it were to break through all of those, the last potential resistance in play would be at about 7,850 from its next daily uptrend (yellow). This is also its next weekly resistance (see the weekly update) so it would be a big area to watch.
If the S&P opens below the 7,774 level from its new primary downtrend (white) then this area will act as resistance on a rally attempt with every other level mentioned above remaining as resistance as well. On a continuation of the pullback, the next support to watch will be at 7,760 (red) which is just below today's close as well - so there is risk of a gap below this level. If it gaps below 7,760 then it would also become resistance. After that, the next support to watch would be at 7,718-7,719 (green). If this breaks, the last 2 daily supports likely in play for tomorrow would be at 7,695 (blue) and 7,685 (orange).
The Russell 2000 had a strong reversal today as we saw a rotation back into small caps and out of the AI trade. It closed at the highs of day but remains in its big primary downtrend, so it doesn't start any new daily trends for tomorrow. One thing to watch for is that there is now potential bullish divergence for it with today's reversal, but it needs to see a follow through bounce tomorrow to confirm this divergence.
For now, this primary downtrend continues to be the only daily range to watch. Resistance from the top of the range will be at 2,860-2,865 tomorrow while support from the bottom of the range will be at 2,680-2,685.