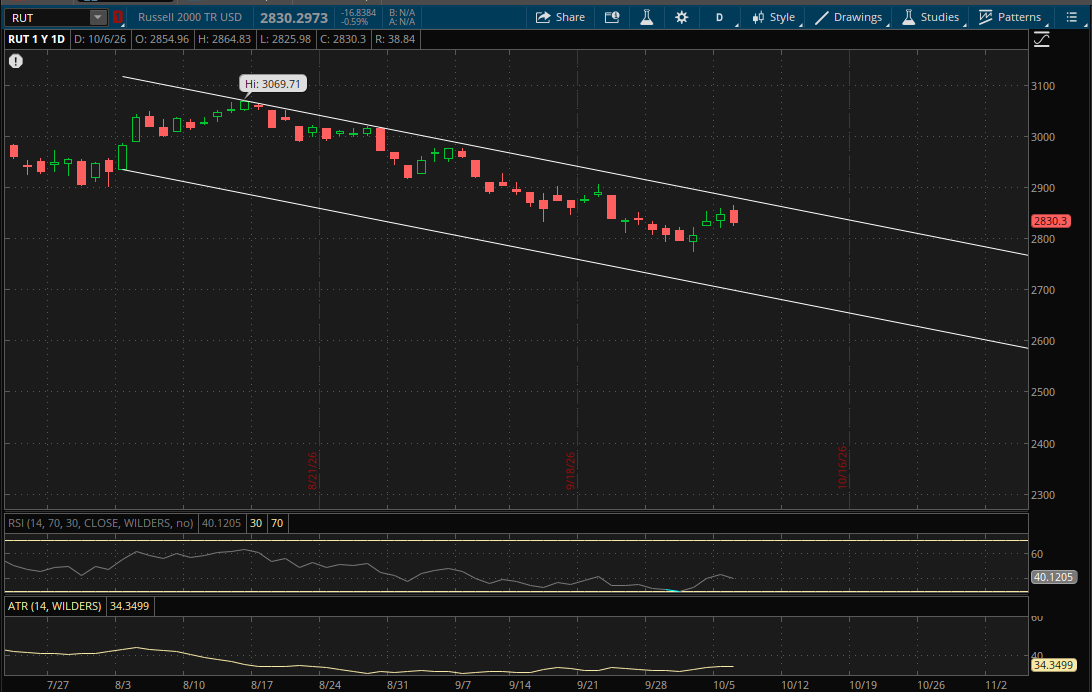
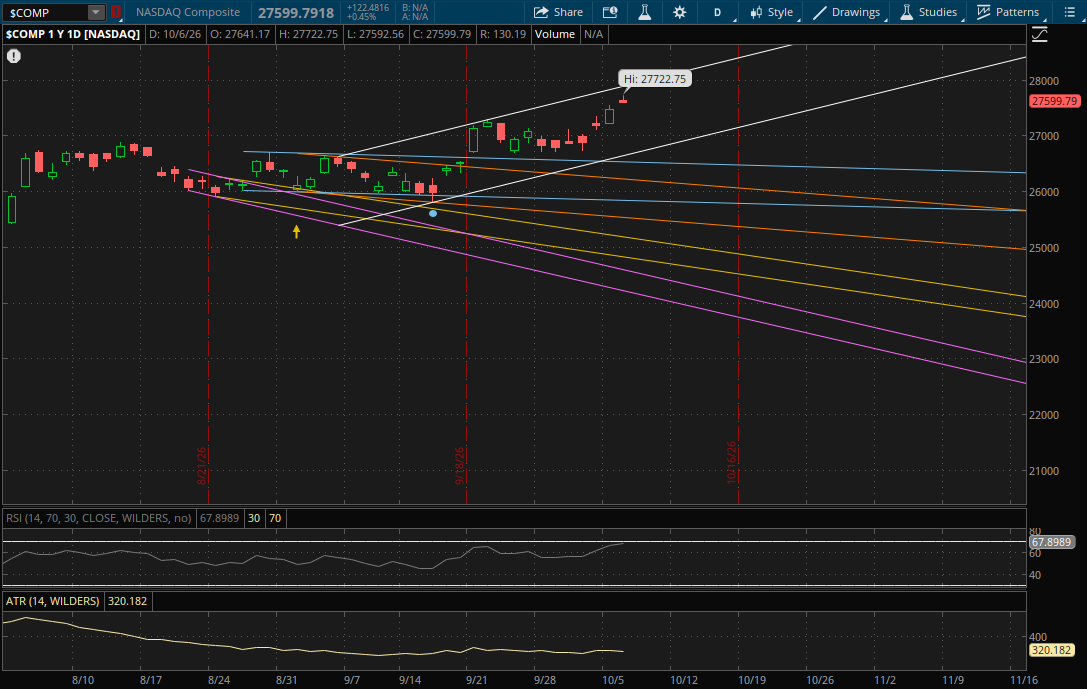
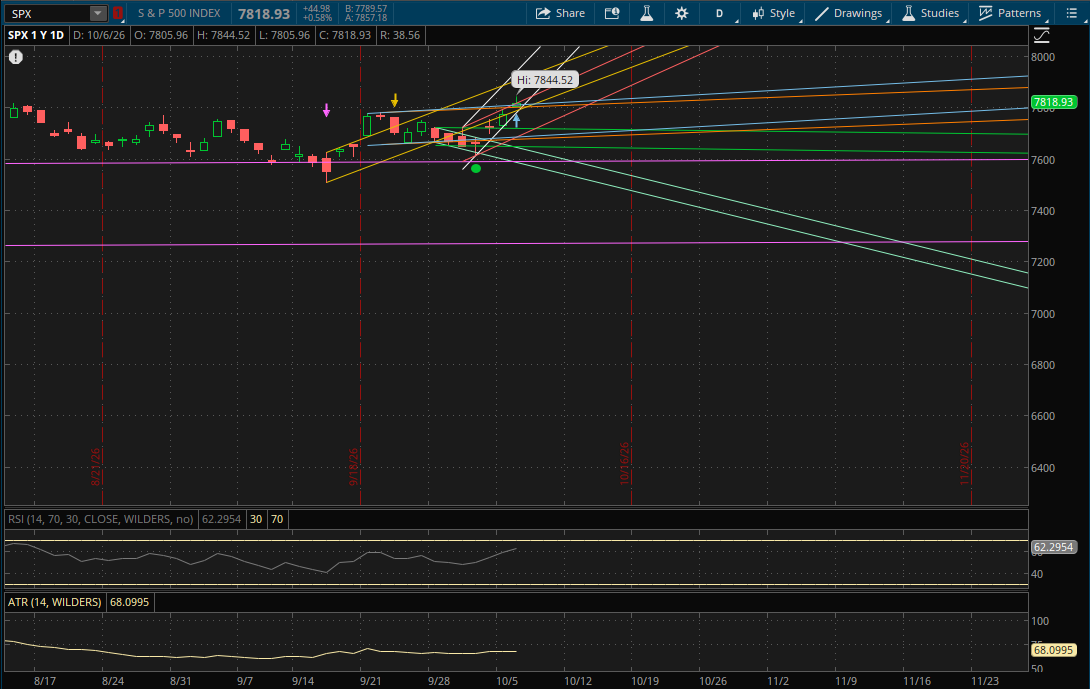
The S&P led today hitting its first new all time high today since mid-August, as it closed up 0.58% above 7,800. The Nasdaq also hit a new all time high and closed up 0.45%. Meanwhile the Russell 2000 was a big laggard today, closing down 0.59%. Despite yields pulling back a bit, small caps failed to participate in the rally today. The VIX continued its decline, settling at $15.01 for a loss of 3.30%.
The Nasdaq continued to trade within its big primary uptrend (white) so it doesn't start any new ranges again for tomorrow. While it did close higher and reached a new all time high, it was a pretty weak finish at the lows of the day. For tomorrow this primary uptrend will again be the only daily resistance to watch around 27,950. The bottom of this primary uptrend will also potentially be the only support in play on a pullback around 26,700. However, it's over 3% away so it probably won't be tested.
The S&P broke and closed just above yesterday's primary uptrend, however it was also a weak finish closer to the lows of the day. Since it did make a higher high, it still starts a new uptrend for tomorrow. But it will have to gap up above 7,840 to open above its new primary uptrend (white). The S&P closed at 7,818.93 so it's not that far away and it could potentially get that gap up. If it does, the last daily resistance to watch will be just above it at about 7,843-7,844 from its next uptrend (red). Those will be the only daily resistances in play, but it will also have weekly resistance right around 7,850 (see the weekly update).
If the S&P fails to get the gap above its primary uptrend (white) tomorrow around 7,840 then this level will become resistance on a rally attempt. On a pullback, the next support to watch would be at about 7,815 (blue) followed by 7,808-7,810 (yellow), and 7,804-7,805 (orange). Now all of these supports are also very close to today's close and it's possible that the S&P gaps below some or all of those levels as well. If that were to happen, these levels would then become resistances as well. After these levels, the next big support area to watch would be at 7,710-7,720 from its next 2 trends (green and red).
The Russell 2000 made an attempt to break through its big primary downtrend that it has been trading in since early August, but it failed to get there so it doesn't start any new ranges for tomorrow. Its primary downtrend will continue to be the only range to watch for now with resistance at about 2,875 from the top of the range and support at 2,690-2,695 from the bottom end of the range. Even with another pullback it's unlikely that the bottom end of this range gets tested as it is nearly 5% away - instead, it would likely continue to just trade within this primary downtrend.