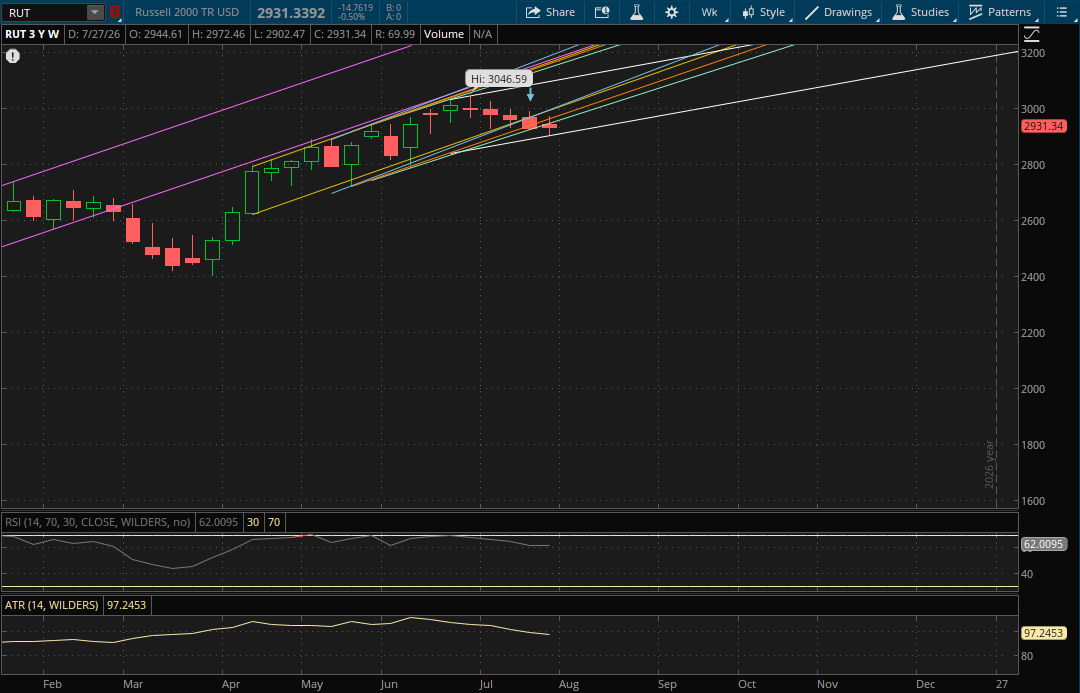
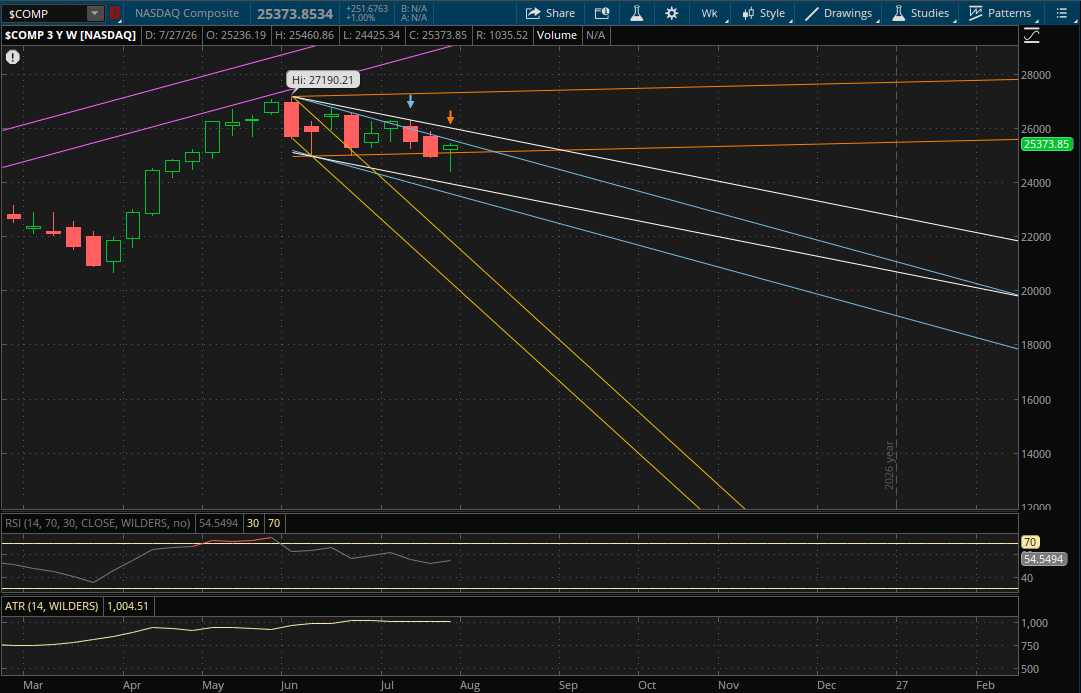
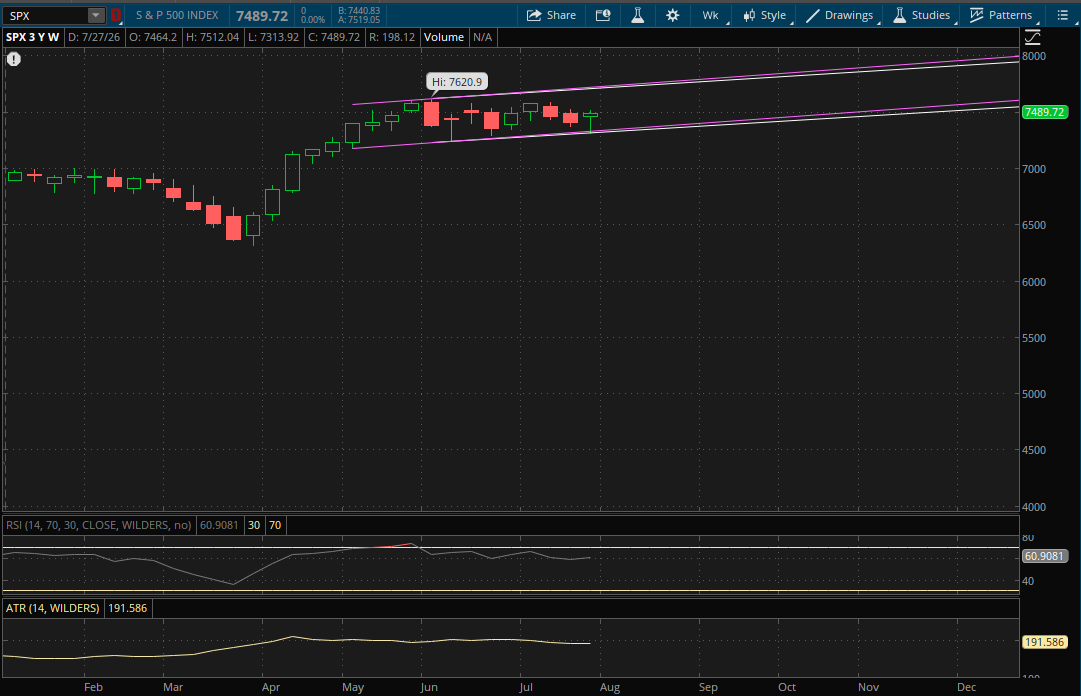
After Wednesday's post Fed sell-off in the markets, the Nasdaq and S&P came roaring back into the end of the week and finished near the highs of week. The Nasdaq posted a gain of 1.6% while the S&P gained 1%. Small caps on the other hand lagged and finished the week flat after treasury yields continued to rise with the 10 year yield reaching 4.74% - its highest level since January of 2025. After nearly reaching $21, the VIX finished just off of the lows of week at $15.99 for a weekly loss of about 14%.
Next week we will continue to get earnings reports from some big tech names including AMD and Palantir, however most of the major tech earnings are out of the way for now. The big economic data to watch next week will be Friday's employment situation report which will include July nonfarm payrolls data and the unemployment rate. For the report, the expectation is for 88,000 jobs to be added while the unemployment rate is expected to remain unchanged at 4.2%.
With the rally back late in the week. the Nasdaq finished near the highs but didn't break through its primary downtrend, so it doesn't start any new weekly trends for next week. The first weekly resistance to watch next week will be from its prior downtrend (blue) at 25,375-25,400 which is just above Friday's close of 25,373. If it can gap up on Monday above this area it will become support. After that, the last weekly resistance to watch will be at 25,875-25,900 from its primary downtrend (white).
If the Nasdaq fails to get the gap above the 25,375-25,400 area on Monday then that level (blue) will continue to act as resistance for now. On a pullback, the first support to watch will be from its prior sideways range (orange) at 25,100-25,125. If it were to gap below that area on Monday, then it would become resistance as well. After that, its primary downtrend (white) would be the next support to watch on another sell-off at 23,800-23,825 and if that doesn't hold either then the last weekly support potentially in play would be from its next downtrend (blue) at about 23,375.
The S&P broke just below its primary weekly trend that it had been trading in since early-May. It rallied back to finish strong near the highs and closed well above that prior uptrend support which gives it a failed breakdown and starts a new primary uptrend (white) for it. This primary uptrend will be the first weekly resistance to watch on a rally at 7,715-7,720 which would be new all time highs for it. After that, its prior uptrend (purple) would be the last weekly resistance at 7,735-7,740.
On another pullback, the first support to watch will be from its prior uptrend (purple) at about 7,340 which would be a retest of the failed breakdown. If it doesn't hold, its new primary uptrend (white) would be the last weekly support at about 7,325.
The Russell 2000 closed below its last weekly uptrend support, but for now it still starts a new primary uptrend (white). This new primary uptrend will be its only weekly support to watch at 2,915-2,920 next week. If it breaks down through this uptrend as well then it will start a new trend going into the following week, and if it takes out this week's low of 2,902.47 then that new trend will be a downtrend regardless of how it finishes.
On a bounce back next week, all of its prior uptrends will act as resistances. The first one being at about 2,970 (teal) followed by 2,990 (orange). Its last two weekly resistances will be at 3,020-3,025 from both of its next two uptrends (yellow and blue).