Markets mostly closed lower today with tech lagging significantly as the Nasdaq closed down 0.84%, although semiconductors were a bright spot within overall tech as the SOXX closed up 1.3%. The S&P also closed lower by 0.37% meanwhile small caps were the standout leader with the Russell 2000 finishing higher by 0.45%. After the market closed there was news from Israeli Channel 12 that a one-month long ceasefire was being discussed between Iran and US negotiators. Markets are rallying on this news after hours with small caps up about 1.3% while the Nasdaq and S&P are up about 0.7%. We'll have to see if this after hours action holds into tomorrow's open.
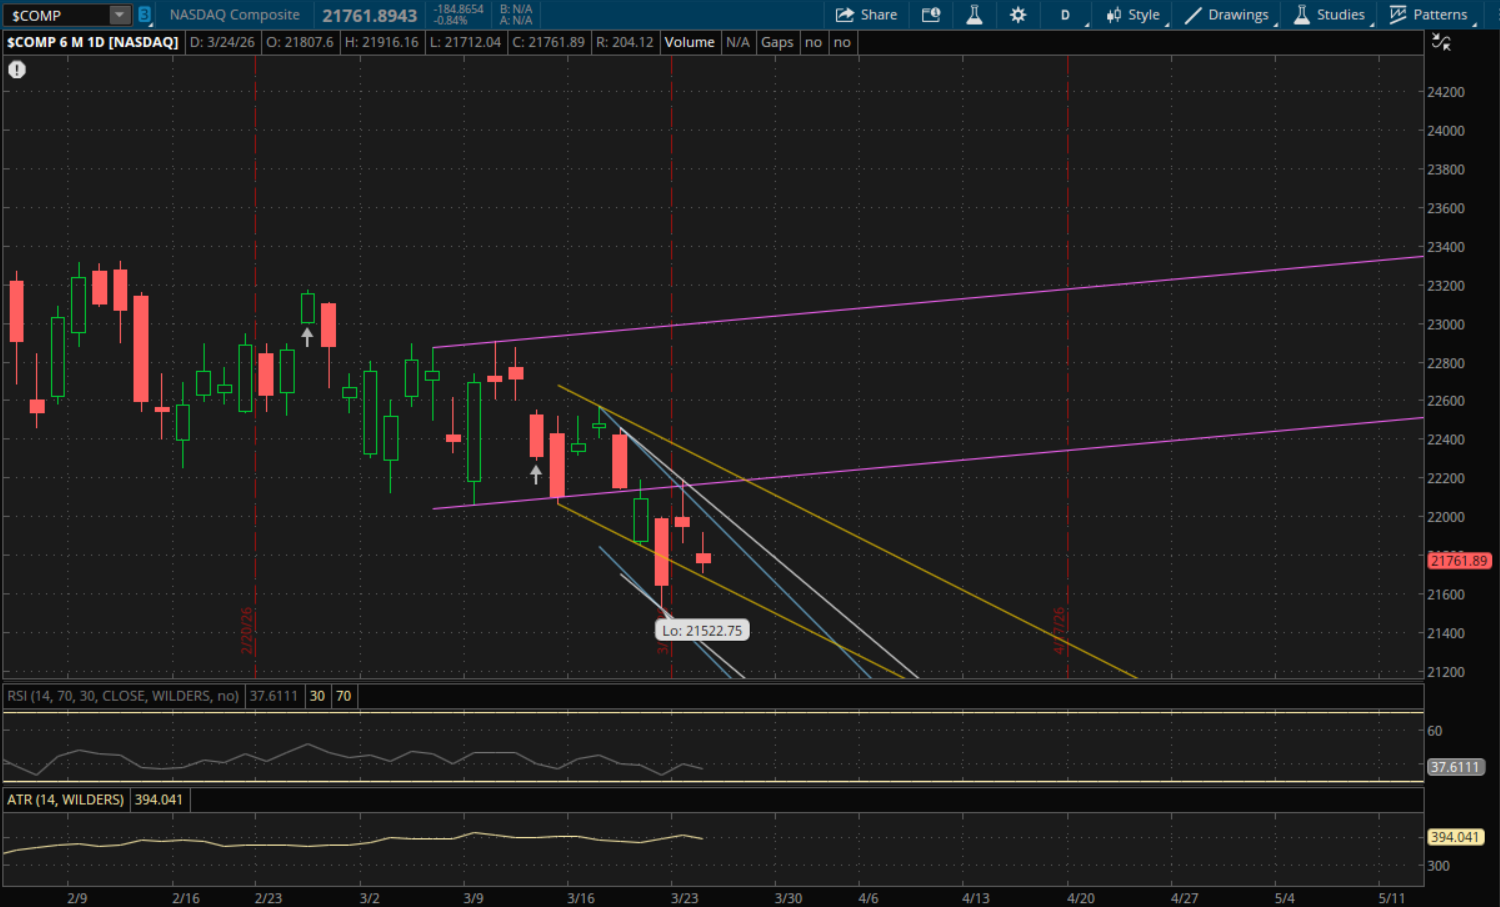
Yesterday I mentioned that the Nasdaq had the weakest finish and that it had a failed breakout on the daily. So it waisn't surprising to see it being the laggard in today's session. It bounced right around its first weekly support and it also held daily support and it didn't break through any trends today, so it doesn't start any new trends going into tomorrow. With the after hours action right now on the ceasefire headlines we could see a significant gap above some key resistance levels for tomorrow. The first level to watch will be its prior downtrend (blue) at 21,920. After that its primary downtrend (white) will be just above 22,000. If it can break through this level then it will start a new trend, but we'll have to see how it finishes first. Above its primary downtrend, there will also be resistance from its prior uptrend (purple) at 22,180 and then its last resistance will be from its next downtrend (yellow) at 22,240.
If this after hours action doesn't hold and we get another pullback tomorrow, then the first support to watch will be at 21,635 from its prior downtrend (yellow) which it held today. After that its next support would be far away at its primary downtrend (white) which will be at 21,250 followed by its last downtrend support (blue) at 21,200.
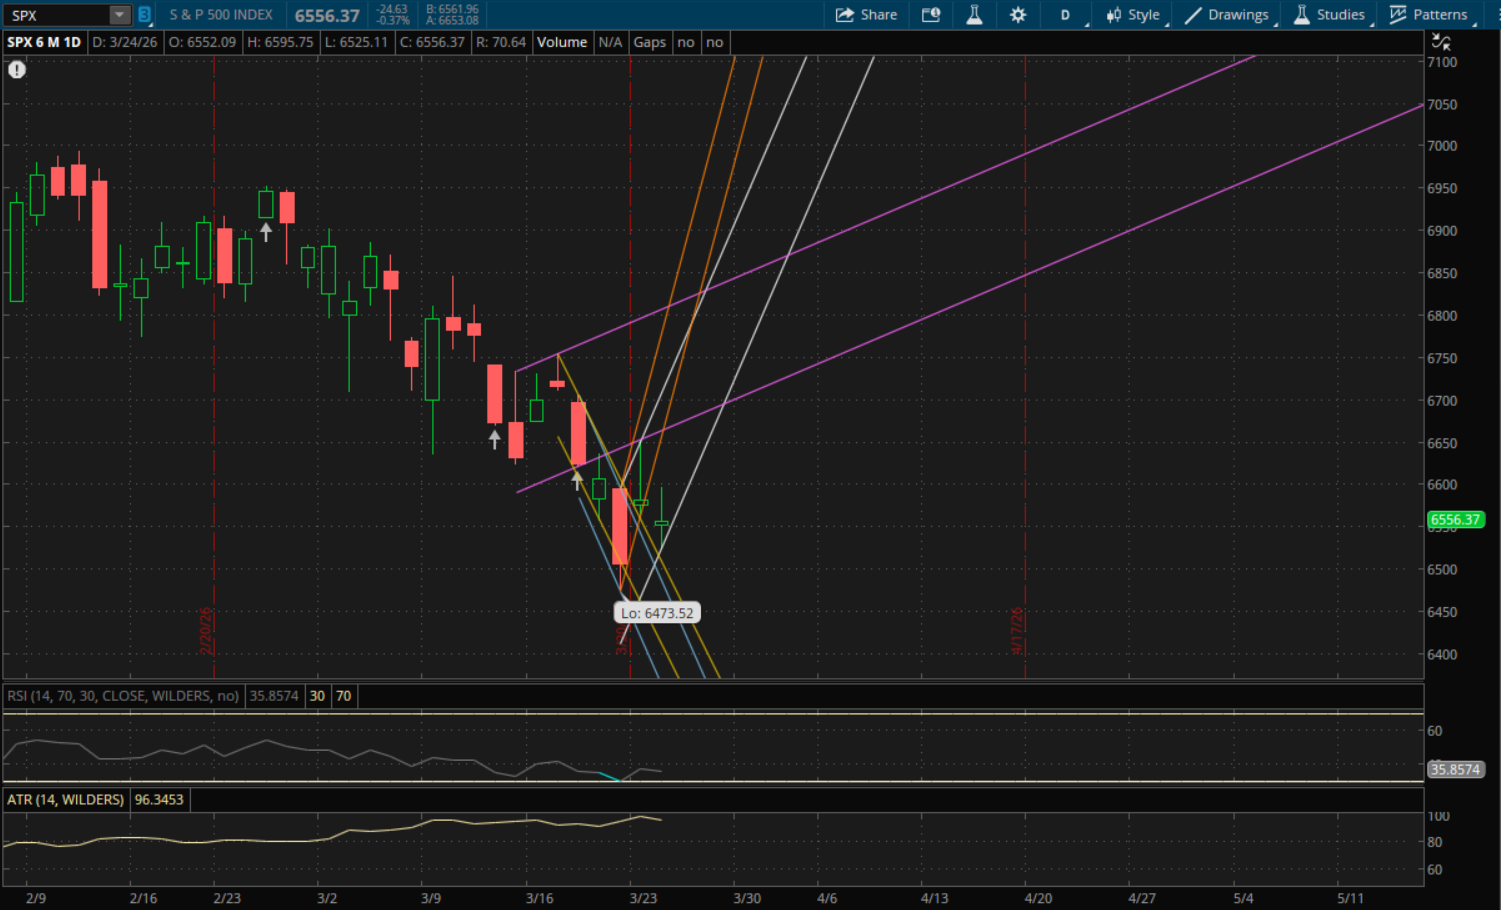
The S&P gapped down and closed below yesterday's uptrend support, but it didn't break through last week's lows so it still starts a new uptrend. Now its new uptrend will be support/resistance at about 6,582 tomorrow. It closed at 6,556 today and normally I'd say the odds are it opens below it, but due to the after hours action right now it could very well gap over this 6,582 level tomorrow morning in which case that area becomes support. From there the next resistance on a rally would be at 6,674 from its prior uptrend (purple). If it breaks through that level then the next resistance would be at 6,750 from its prior uptrend (orange) that it gapped below today and finally its new primary uptrend (white) would be resistance at 6,765.
If the S&P fails to open above its new primary uptrend (white) at 6,582 tomorrow then this level will be the first resistance to watch on a rally attempt. And if we get another sell-off then the first support to watch will be from its prior downtrend (yellow) at 6,460 followed by its next downtrend (blue) at 6,430. These same trends would be supports again from the bottom ends of the ranges at 6,360 (yellow) and 6,307 (blue).
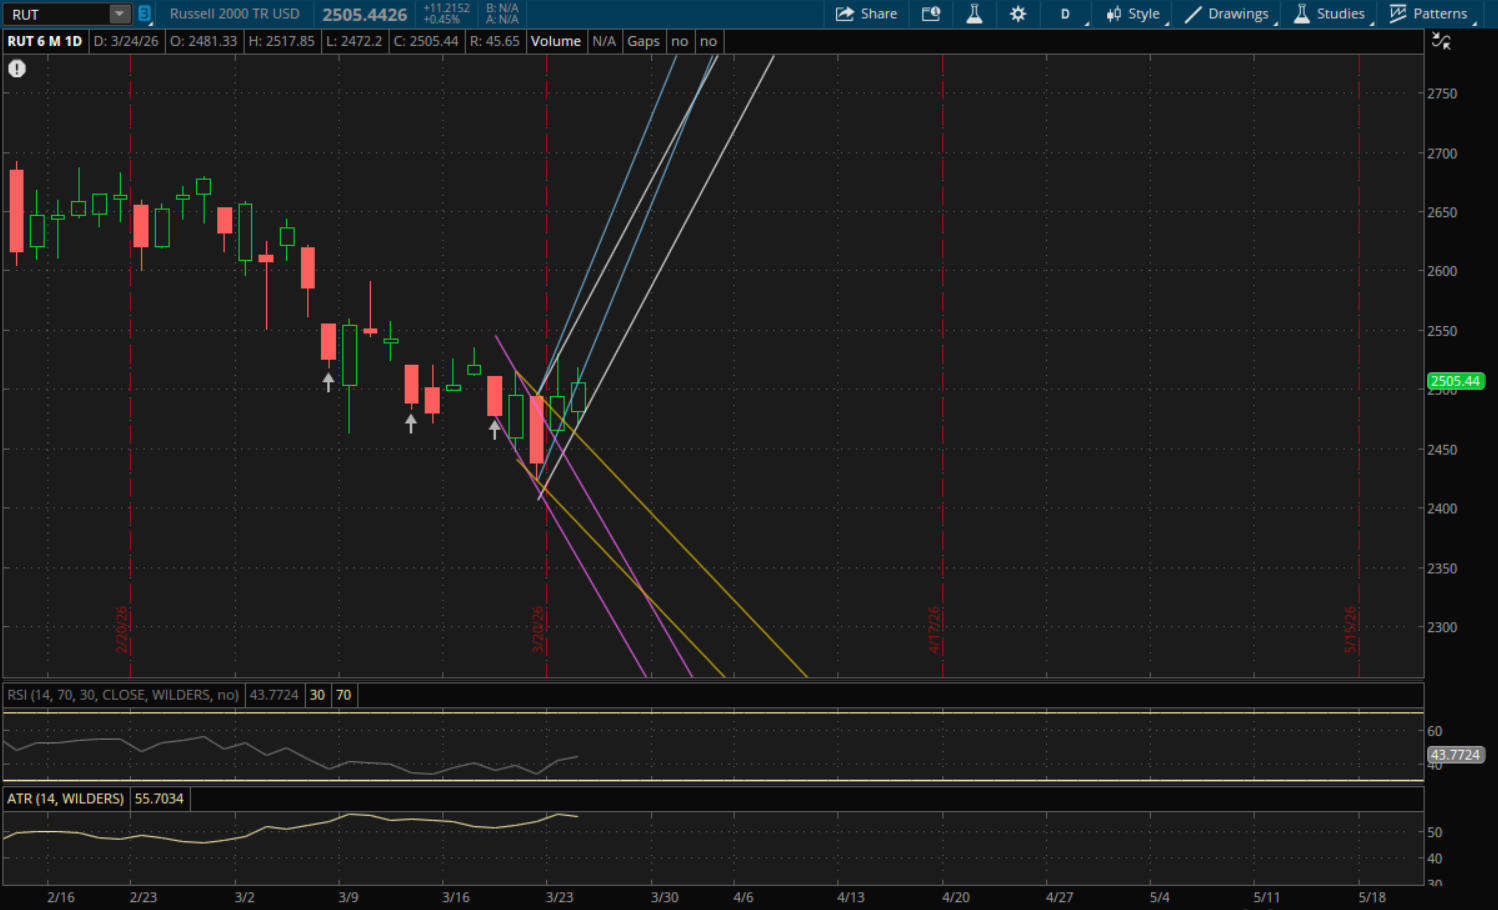
The Russell 2000 also failed to gap above yesterday's primary uptrend, and it closed below it, but it closed just below it and it wasn't a weak finish. It held most of its gains today and it also started a new uptrend as it made a higher low. Its new primary uptrend (white) will be support/resistance tomorrow right around 2,505 which is where it finished today. So given the after hours action it likely will open well above it and that level would be support on a pullback. The next resistance to watch would be from the uptrend that it closed below today (blue) which will be at 2,550. After that its primary uptrend (white) comes into play again at the top of its range which will be at 2,595 and lastly its prior uptrend (blue) also comes into play again from the top of its range at about 2,623.
If this after hours action reverses and the Russell 2000 opens lower tomorrow below the first key level of 2,505, then the first support to watch on a pullback would be from its prior downtrend (yellow) at 2,440. After that its prior downtrend (yellow) would be support at 2,393 and then these same two channels come into play again from the bottom ends of those ranges at 2,367 (yellow) and 2,325 (purple).