Yesterday the Nasdaq lagged again as the unwind in the semi/AI trade continued. The Nasdaq closed down 1.4% while the S&P lost 1%. Small caps continued to outperform, but the Russell 2000 also closed lower by about 0.4%. Oil also contributed to the market sell-off as tensions continued to rise between the U.S. and Iran. Oil closed up 4.5%, finishing above $80/barrel and hitting its highest levels in over a month. The VIX closed up 12% at $18.77 which was off the highs of $19.50, but this was the highest it has gotten since late June.
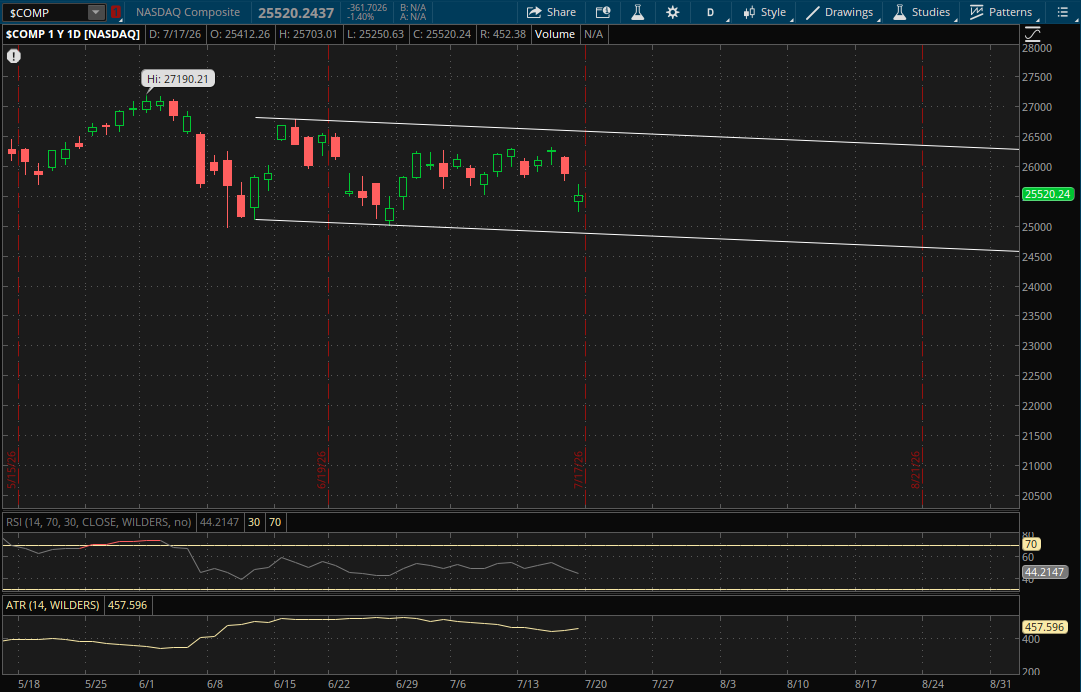
With yesterday's sell-off the Nasdaq pulled back closer to the bottom end of its primary daily downtrend (white). It still hasn't broken through this range, so it doesn't start any new ranges yet. This primary downtrend will again be the only support/resistance level to watch with support at about 24,875 and resistance around 26,575-26,600 for Monday.
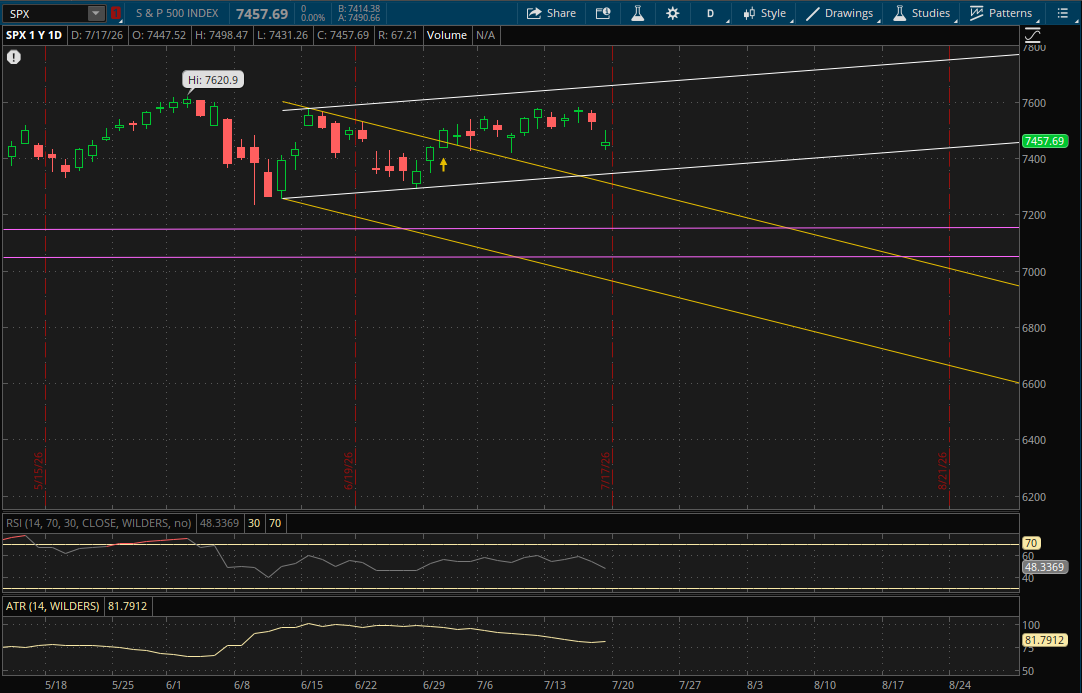
The S&P similarly remained in its primary uptrend (white) so it also won't start a new trend yet. Its primary uptrend will be the only resistance to watch at 7,660-7,665 in the event of a big rally. This range will also be the first support to watch at about 7,350 on a continued pullback. If that doesn't hold, the last support in play for Monday would likely be its prior downtrend (yellow) at 7,300-7,305.
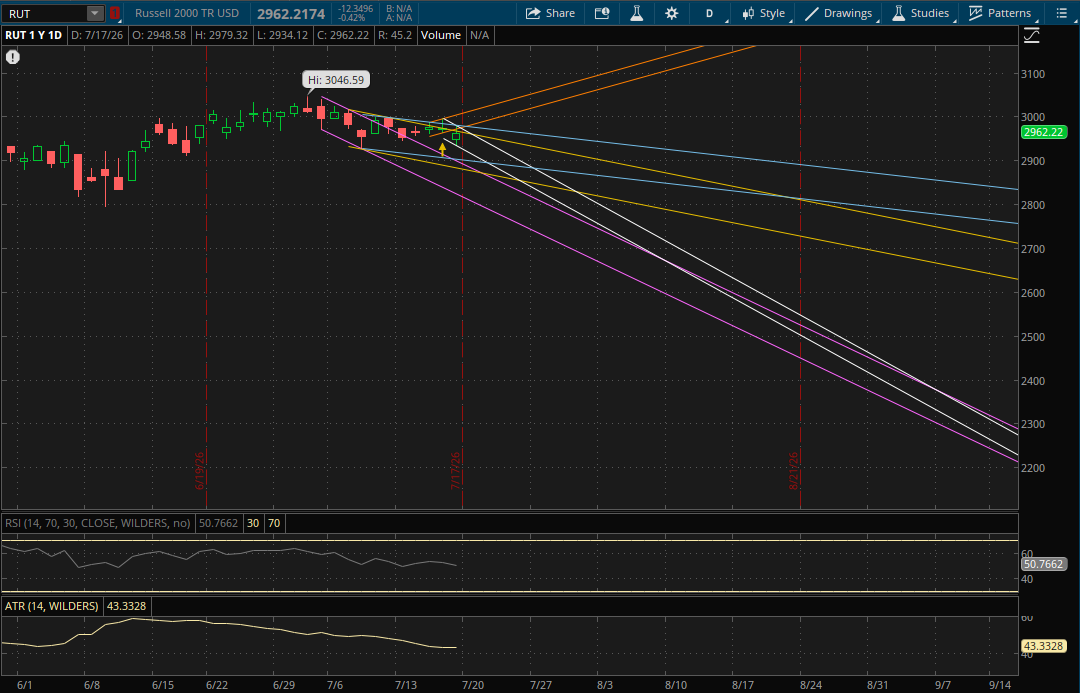
The Russell 2000 didn't get the gap up I was looking for yesterday but it did briefly turn positive as the dip was bought at the open. I did exit my long position on that early recovery, and it did finish well off of its lows. However, it did close below its previous primary uptrend and started a new primary downtrend (white) for Monday.
The first key level to watch on Monday will be at about 2,962. This is going to be support/resistance from both its new primary downtrend (white) and its prior downtrend (yellow) where the two trends intersect. The Russell closed at 2,962 on Friday, so it's right there. How it opens on Monday is going to determine whether this 2,962 area will act as support or resistance. If it opens above it, it will act as support, and vice versa if it opens below it. If it does open above 2,962, then the next resistance level to watch on another rally attempt will be at about 2,977 from its next downtrend (blue) and then the 2,980 level will be the last resistance from its prior uptrend (orange).
Now if the Russell fails to open higher again and it gaps below 2,962, then this level becomes the first resistance area to watch. If it does open above it, but breaks through it, then the next support to watch will be from its new primary downtrend (white - bottom of the range) at 2,916-2,917. If that doesn't hold, its next support will be just under 2,900 from its prior downtrend (blue - bottom of the range). After that, the last two supports to watch will be at about 2,884 (purple) and 2,878 (yellow).