Despite tensions flaring up between the U.S. and Iran again, the markets were mostly positive this week. The Nasdaq gained 1.7% for the week while the S&P added about 1%. Small caps were the laggard as the Russell 2000 posted a weekly loss of 0.6% - but it was well off of the lows. The VIX lost 5% for the week and had its lowest weekly close since the first week of January.
For next week, the biggest economic data will come on Tuesday, July 14th, at 8:30 AM ET with month-over-month (MoM) CPI (consumer price index) which will shed more light on the inflation front. This will be the last major inflation report before the next Fed rate decision on July 29th. Currently, markets are pricing in no change in rates with about a 66% chance while there is about a 34% chance for a 25bps hike. We will also be getting earnings reports from some of the big banks as earnings season officially kicks off. Bank of America (BAC), Citigroup (C), Goldman Sachs (GS), and JPMorgan Chase (JPM) will all be releasing their results before the market opens on Tuesday.
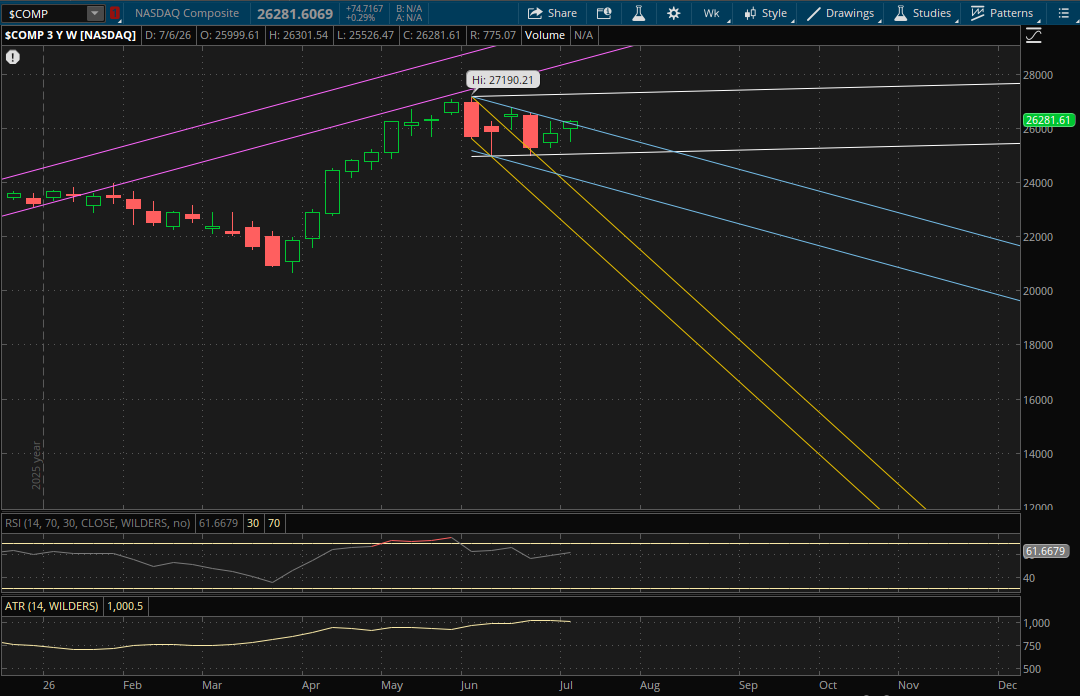
Looking at the weekly technical setups now, the Nasdaq initially got rejected right around the 26,200 level which was its previous primary downtrend resistance. It got rejected there before oil spiked on the Iran-U.S. escalation, but it did rally back and close just above it today. With the close above it, it now starts a new primary uptrend (white) heading into next week.
The first level to watch for the Nasdaq will be from the prior downtrend (blue) which it closed above today. That will be support at 25,975-25,600 on a retest of this weekly breakout. On a continuation of the rally the only resistance to watch will be at 27,275-27,300 from its new primary uptrend (white).
On a pullback, if the first support (blue) does not hold at 25,975-25,600, the next support to watch would be from its primary uptrend (white - bottom of the range) at 25,050-25,075. If that doesn't hold either, the last support in play would again be from its prior downtrend (blue - bottom of the range) at 23,975-24,000.
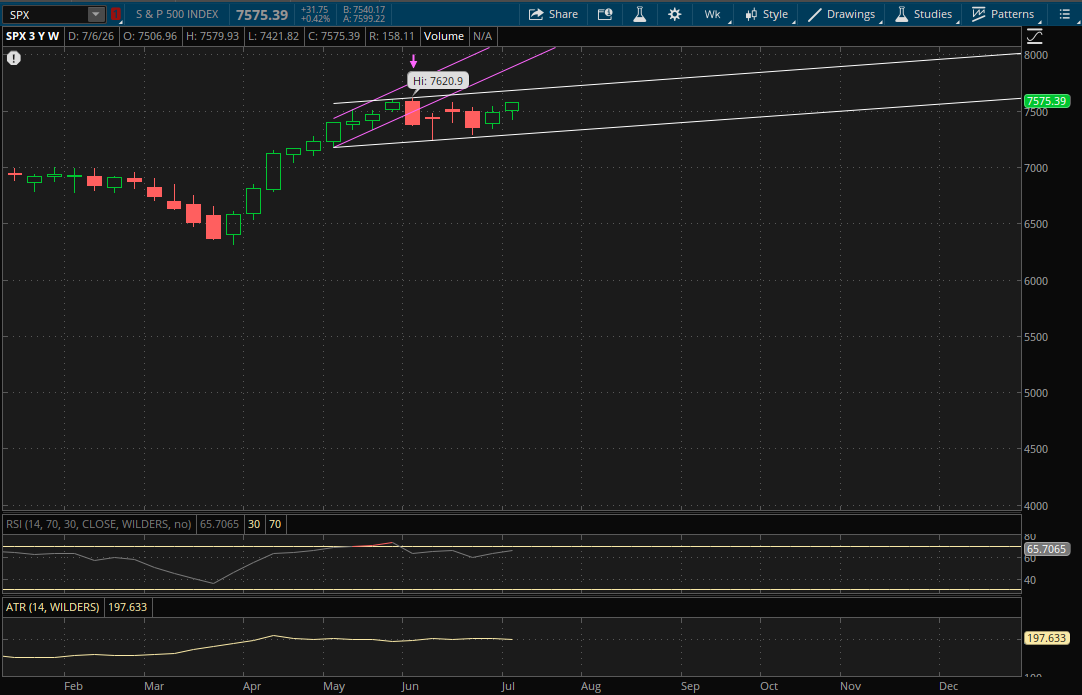
The S&P remained in its primary uptrend, so it doesn't start any new weekly trends for next week. The first resistance to watch on a continuation of the rally will be from its primary uptrend (white) which will be right around 7,700. If it breaks through it, the only other resistance potentially in play would be from its prior uptrend (purple) around 7,975.
On a pullback, the only support to watch will be from its primary uptrend (white - bottom of the range) which will be right around 7,300.
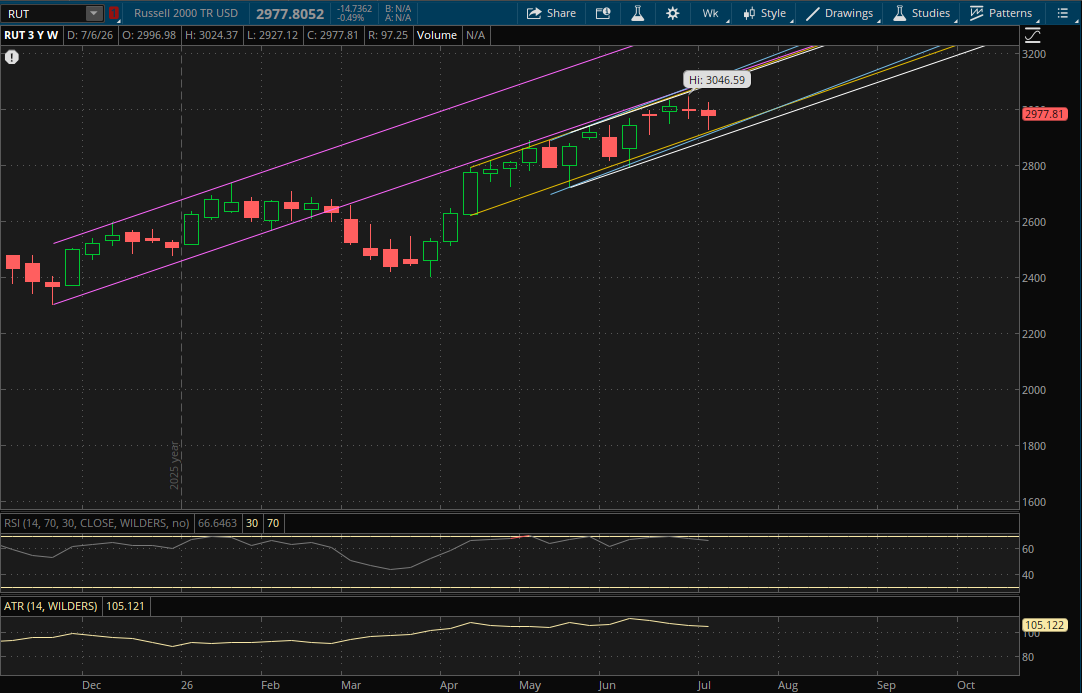
The Russell 2000 pulled back near its first weekly uptrend support (yellow) of 2,920-2,922 this week which held as it put in a low of 2,927.12 before recovering. Since it didn't break through its primary uptrend, it doesn't start any new trends either.
If the rally in small caps resumes next week, the first resistance to watch will be from its primary uptrend (white) at 3,110-3,115 with more just above it from its prior uptrend (yellow) at 3,117-3,118. The last two resistances would be from its next uptrends (purple and blue) at 3,125 and 3,135.
On a continuation of the pullback, the first support to watch will be at 2,946-2,947 from its prior uptrend (yellow) which it bounced around this week. If it doesn't hold this time, its next uptrend (blue) will be support just below that at about 2,940. If that doesn't hold either, its last weekly support will be from its primary uptrend (white) at 2,917-2,918.