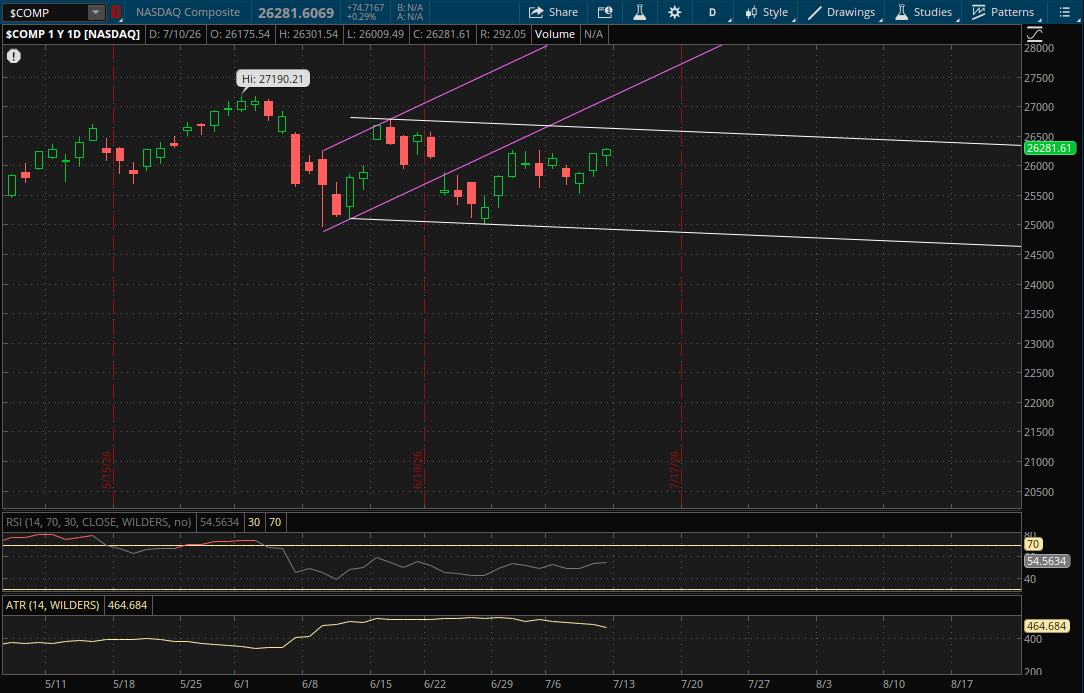
The Nasdaq and S&P both continued their rally today posting gains of 0.29% and 0.42%, respectively. However small caps lagged today with the Russell 2000 closing down 0.49%. The VIX continued its decline, settling down about 5% at $15.03. This was the lowest close for the VIX since January 9th, 2026.
As I mentioned in yesterday's update, it was much more likely for the Nasdaq to continue its rally towards the upper end of its daily range. It continued to inch closer to it today but remains within the range so once again new daily trends will be started. The only daily resistance in play for Monday will be from this primary uptrend (white) which will be around 26,225. This range will also be the only support in play, however it's unlikely to be tested as it will be around 24,925.
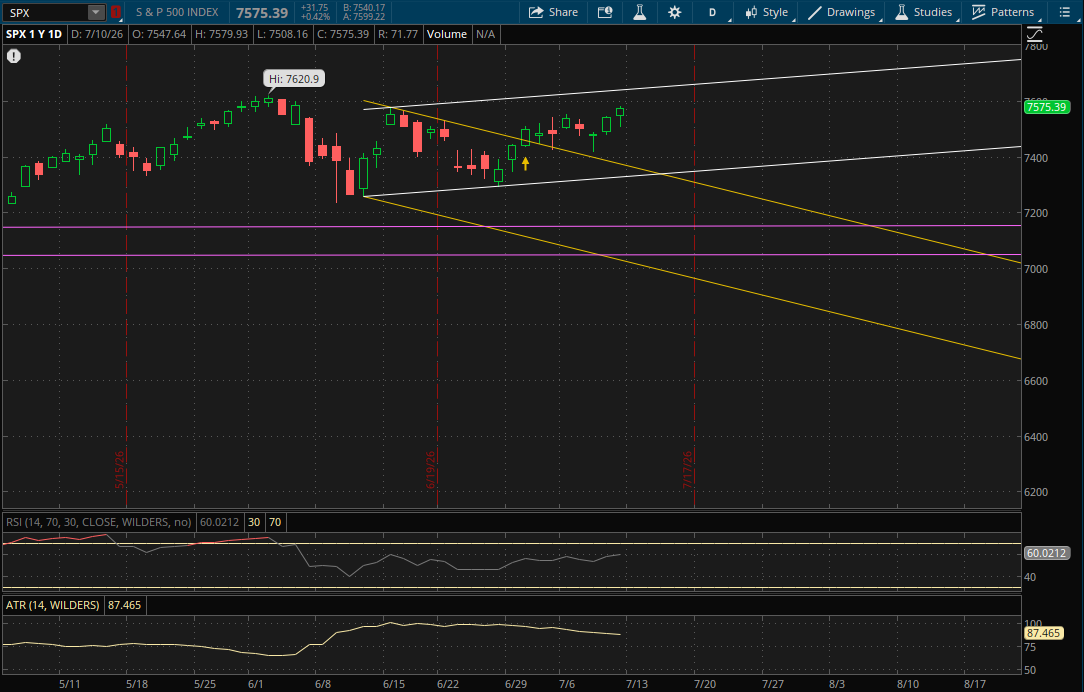
The S&P remains the same as well as it continues to rally towards its primary daily uptrend. For Monday, it will be the only resistance in play again and will be at 7,644-7,645. If there is a pullback, the first support to watch will be from its prior downtrend (yellow) at about 7,362 and then its primary uptrend (bottom of the range) would be the last support at about 7,332.
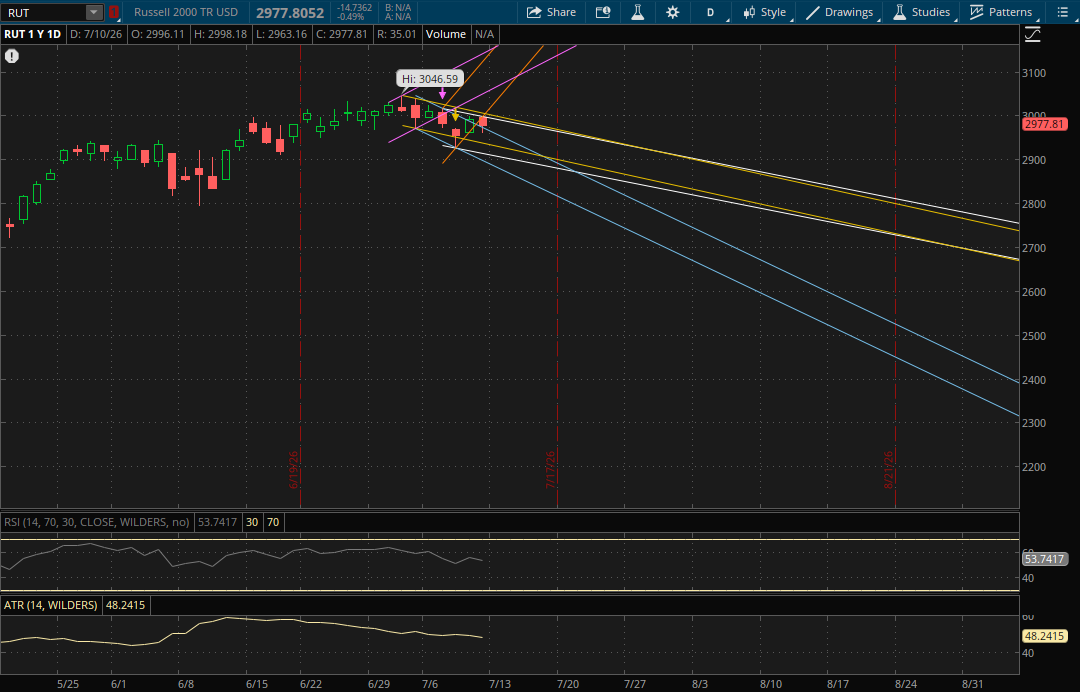
For the Russell 2000, in yesterday's update I noted that it needed to gap above 3,000 in order to open above its primary uptrend otherwise it would become resistance on a rally attempt. Well it failed to get that gap above it, opening at 2,996.11, and it got rejected right around that 3,000 level as it put in a high of 2,998.18 this morning.
Since it did close below yesterday's primary uptrend, and it failed to make a higher high, it now starts a new primary downtrend (white) going into Monday. This primary downtrend will be the first resistance to watch at about 2,992 on a rally attempt. If it breaks through it, its prior downtrend (yellow) would be the next resistance at 2,999-3,000. The last resistance that would potentially be in play on a rally would be from its prior uptrend (orange) at 3,035-3,037.
On a continued pullback, the first support to watch will be from its prior downtrend (blue) at 2,957-2,958. If that doesn't hold, its next downtrend (yellow - bottom of the range) would be the next support at about 2,930. The last support that would potentially be in play would be from its new primary downtrend (white - bottom of the range) at 2,908-2,909.