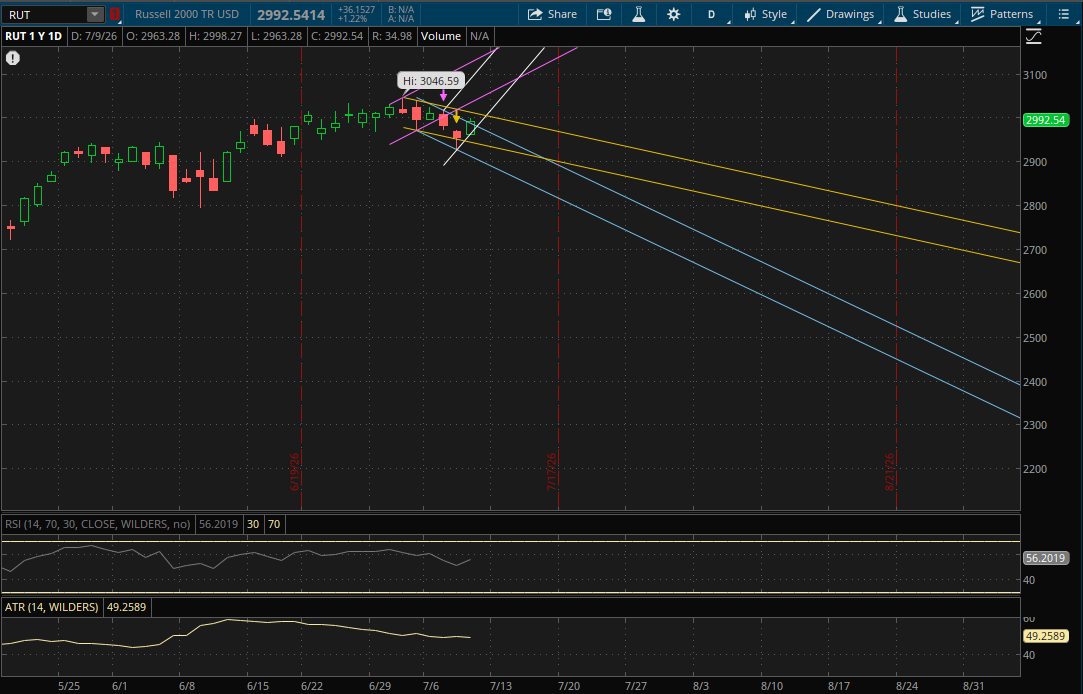
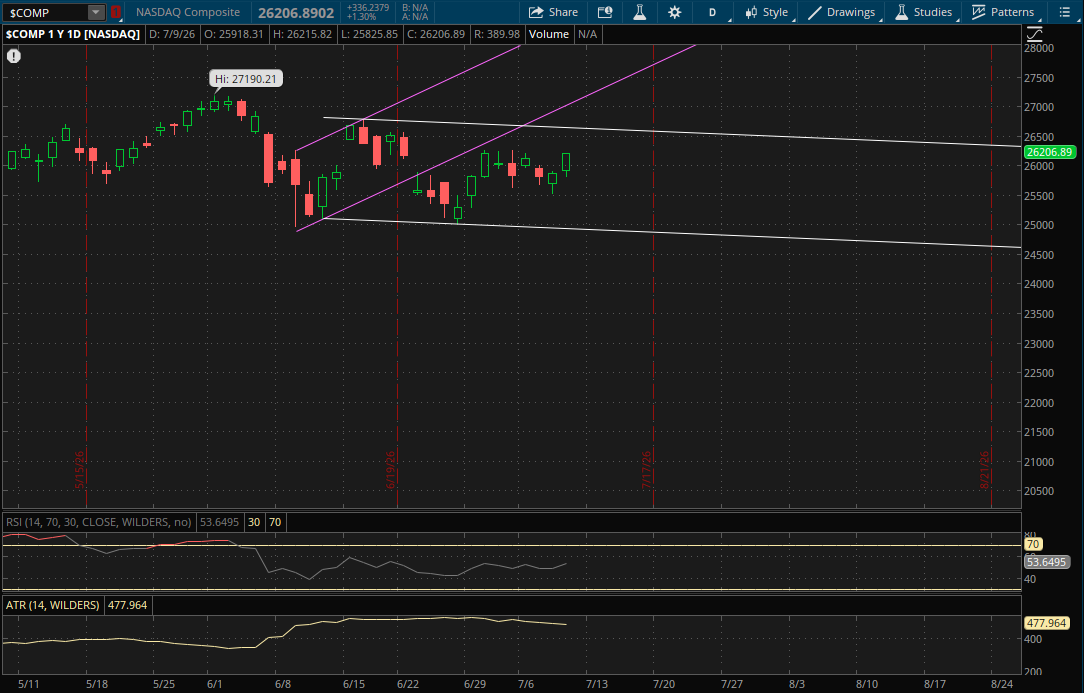
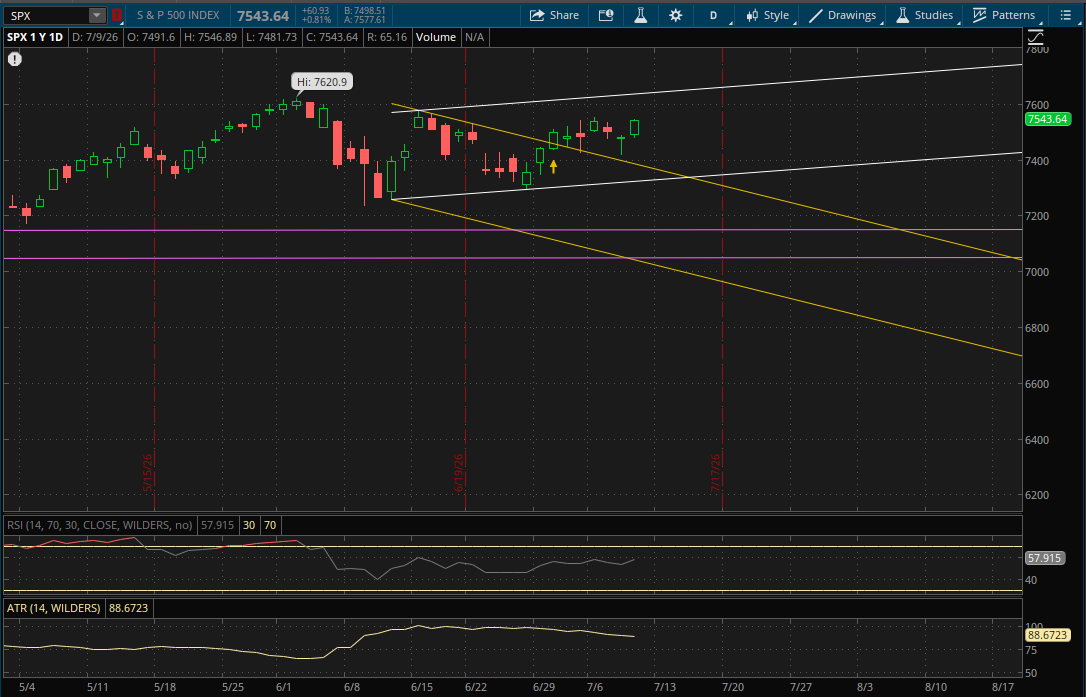
After yesterday's strong reversal, the market had a strong follow through day with the Nasdaq up 1.3%. It was a broad rally though as small caps were also very strong with the Russell 2000 closing up 1.22% while the S&P added 0.81% - and all three indexes essentially finished at the highs of day. With the rally, the VIX fell 6.25% to close back below $16 at $15.87.
For the Nasdaq, nothing changes again as it continues to trade within its large primary range (white). This will be the only range in play again with resistance at about 26,640 and support at about 24,950. Support is pretty far away and its unlikely to get tested even on a pullback. It's much more likely the rally continues towards the upper end of this range.
The S&P also continues to trade within its primary range so it doesn't start any new ranges either. Its primary uptrend (white) will again be the only resistance level in play tomorrow at about 7,640 on a continuation of the rally. On a pullback, the first support to watch will be from its prior downtrend (yellow) at 7,370-7,375 and the last support in play would be from its primary uptrend again (bottom of the range) at 7,325-7,330.
The Russell 2000 had a failed breakdown yesterday and today it had a strong rally back and closed above its primary downtrend that it started yesterday. This now starts a new primary uptrend for it going into tomorrow. However, it does need to gap up again to open above its new primary uptrend (white) which will be just above 3,000. That would require about a 0.3% gap up as it closed at 2,992 today. If it can get this gap up, the 3,000 area would then act as support on a pullback and the next resistance to watch would be from its prior downtrend (yellow) at 3,005-3,006. After that, the last resistance likely to be in play would be from its prior uptrend (purple) at 3,050-3,052.
If the Russell fails to get the gap above the 3,000 level to open above its new primary uptrend (white) then that 3,000 area will act as resistance. On a pullback the first support to watch would then be at about 2,972 from its prior downtrend (blue). If that doesn't hold, the next support will be from its next downtrend (yellow) at about 2,937. The last support to watch would again be from its prior downtrend (blue - bottom of the range) at 2,895-2,900 in the event of a larger sell-off.