Oil had a big jump again today and finished the session near the highs of the day, closing up 10.5% as it approaches $100/barrel once again. This is the new inflation shock for the economy as gas prices have soared over the past couple of weeks. This also continues to hit small caps the hardest as rising inflation means rate cuts are less likely to come. In fact, odds of the next rate cut have been pushed back nearly a year. Last month, the next rate cut was being priced in for this coming June, whereas now it is being priced in for March of 2027. The Russell 2000 closed down another 2.12% today followed by the Nasdaq which lost 1.78% and the S&P which closed down 1.52%. The VIX closed up 12.6% at the highs of the day. Markets are awaiting the next batch of inflation data with PCE tomorrow morning.
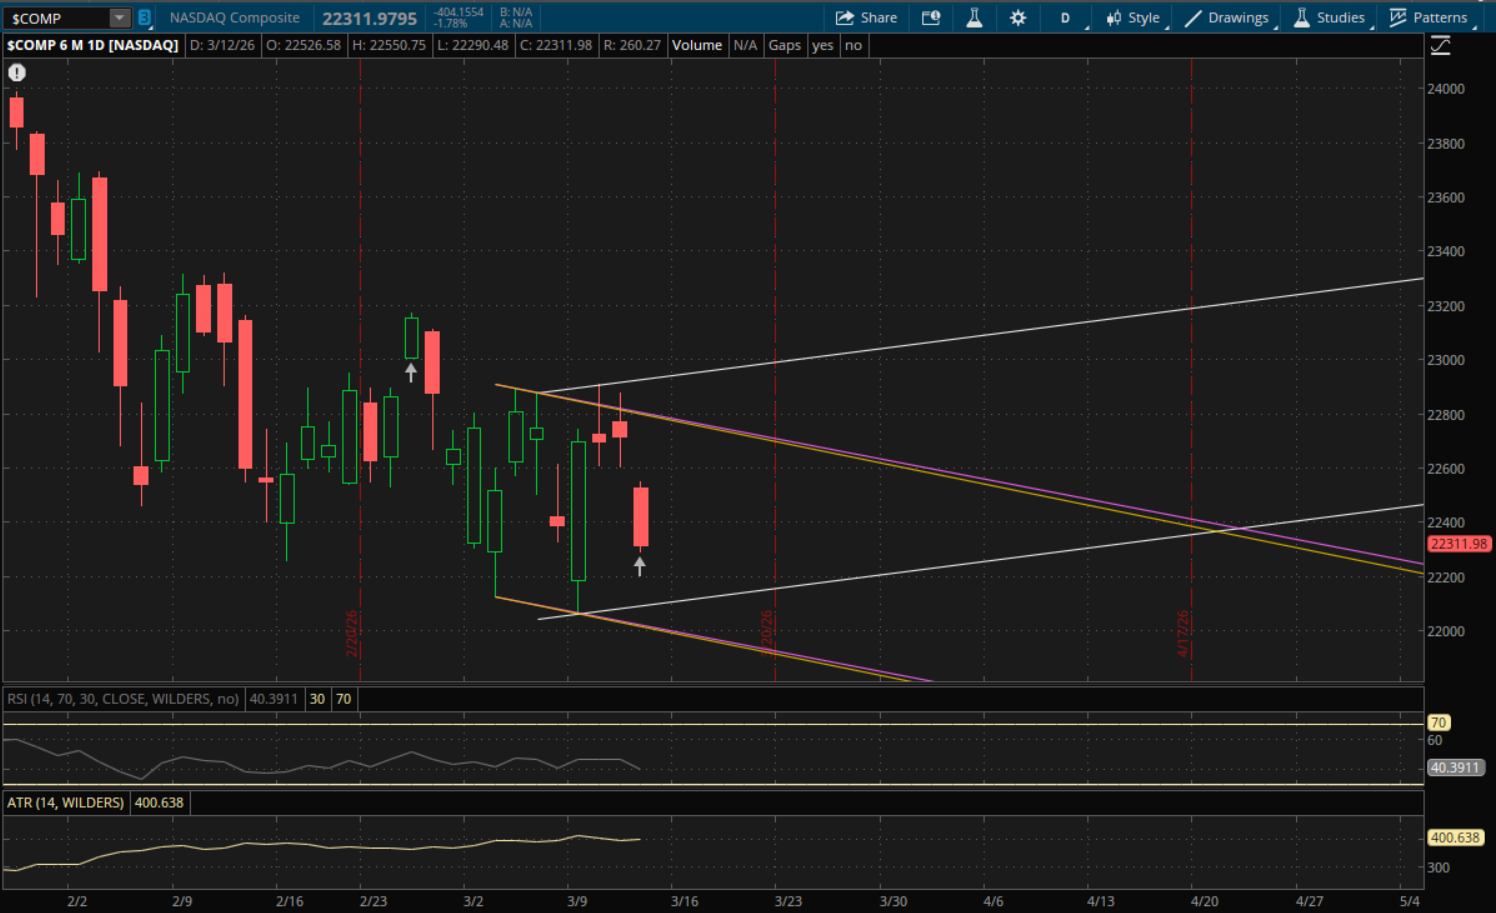
In Tuesday's update I noted that the Nasdaq had a failed breakout and this setup continues to play out as it is now approaching the bottom of its new daily uptrend. It remains in this big range for now and it didn't break through any support or resistances, so once again no new ranges will be started for it. The next support level to watch will be from its primary uptrend (white) which will be at about 22,100 tomorrow. I would be interested in buying the dip here if there's no big gap down below it tomorrow. If it gaps or breaks through this support, then the next levels to watch will be from its prior downtrends (purple and yellow) at about 22,000. Monthly support is also just below this area around 21,925. If we get a big rally back tomorrow then the next resistance levels to watch will be from these same prior downtrends (purple and yellow) at 22,780-22,790. Above that, its primary uptrend (white) would also be resistance around 22,935.
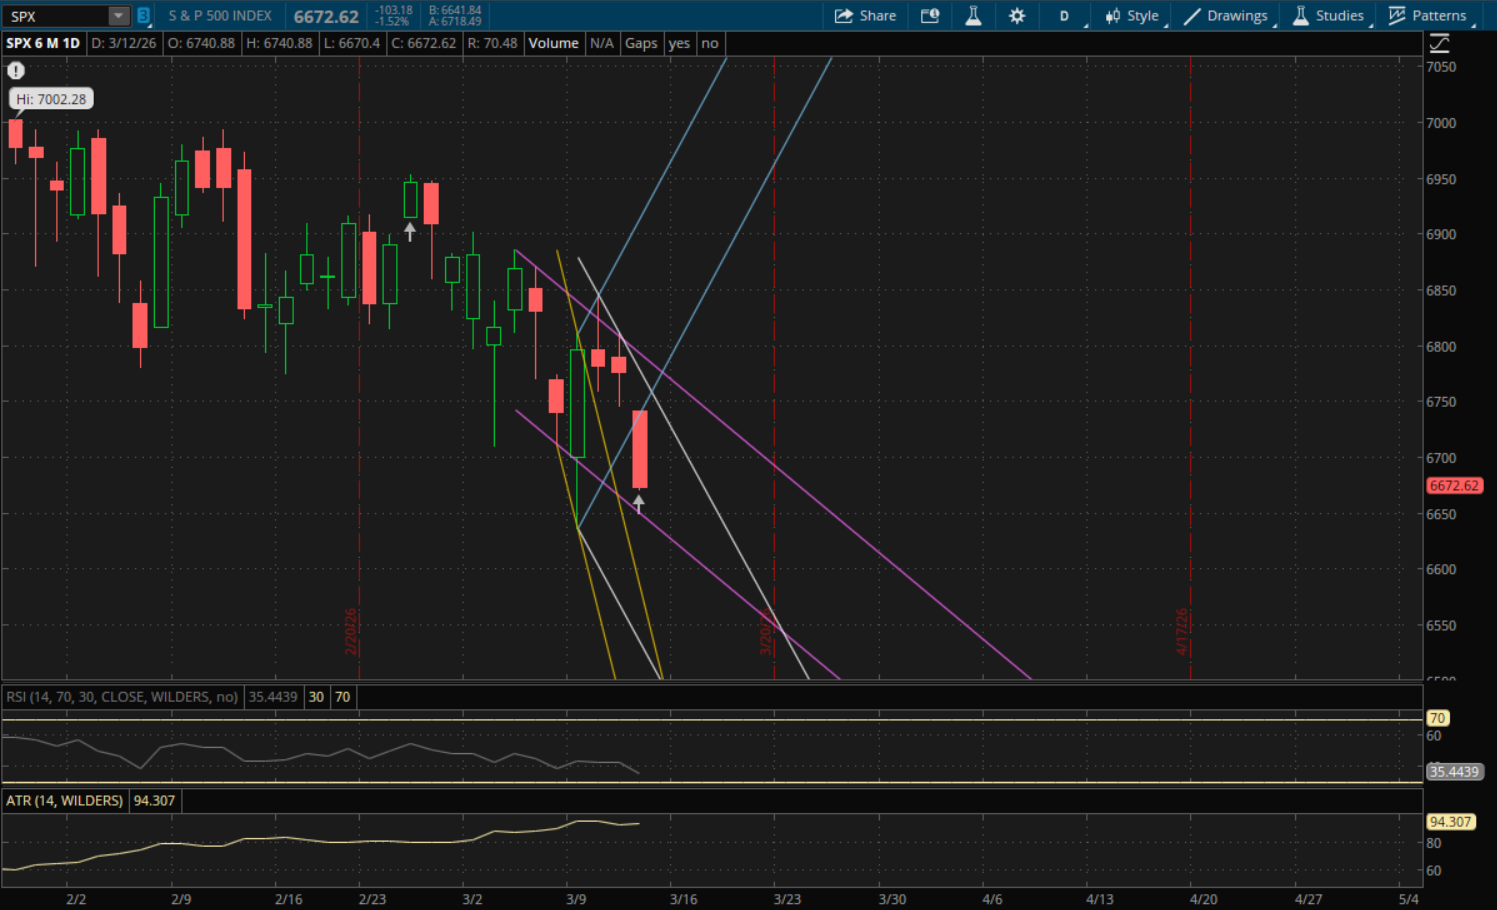
The S&P gapped down right to the 6,740 level that I mentioned in yesterday's update as an area that I would be interested in buying at on a pullback. But, since it gapped down to it and broke below it right away I avoided buying that dip. It broke well below it and closed very weak at the lows of day, starting a new downtrend for it. The next key support to watch will be at about 6,633-6,634 from its prior downtrend (purple). If it breaks or potentially gaps below it then the next supports to watch would be at 6,500-6,510 from both its prior downtrend (yellow) and its new downtrend (white). On a rally attempt, the next resistance to watch will be from its new, primary downtrend (white), at about 6,742 which is just above today's high. If it breaks through that level, the next resistances will be at 6,775-6,778 from both its prior uptrend (blue) and prior downtrend (purple).
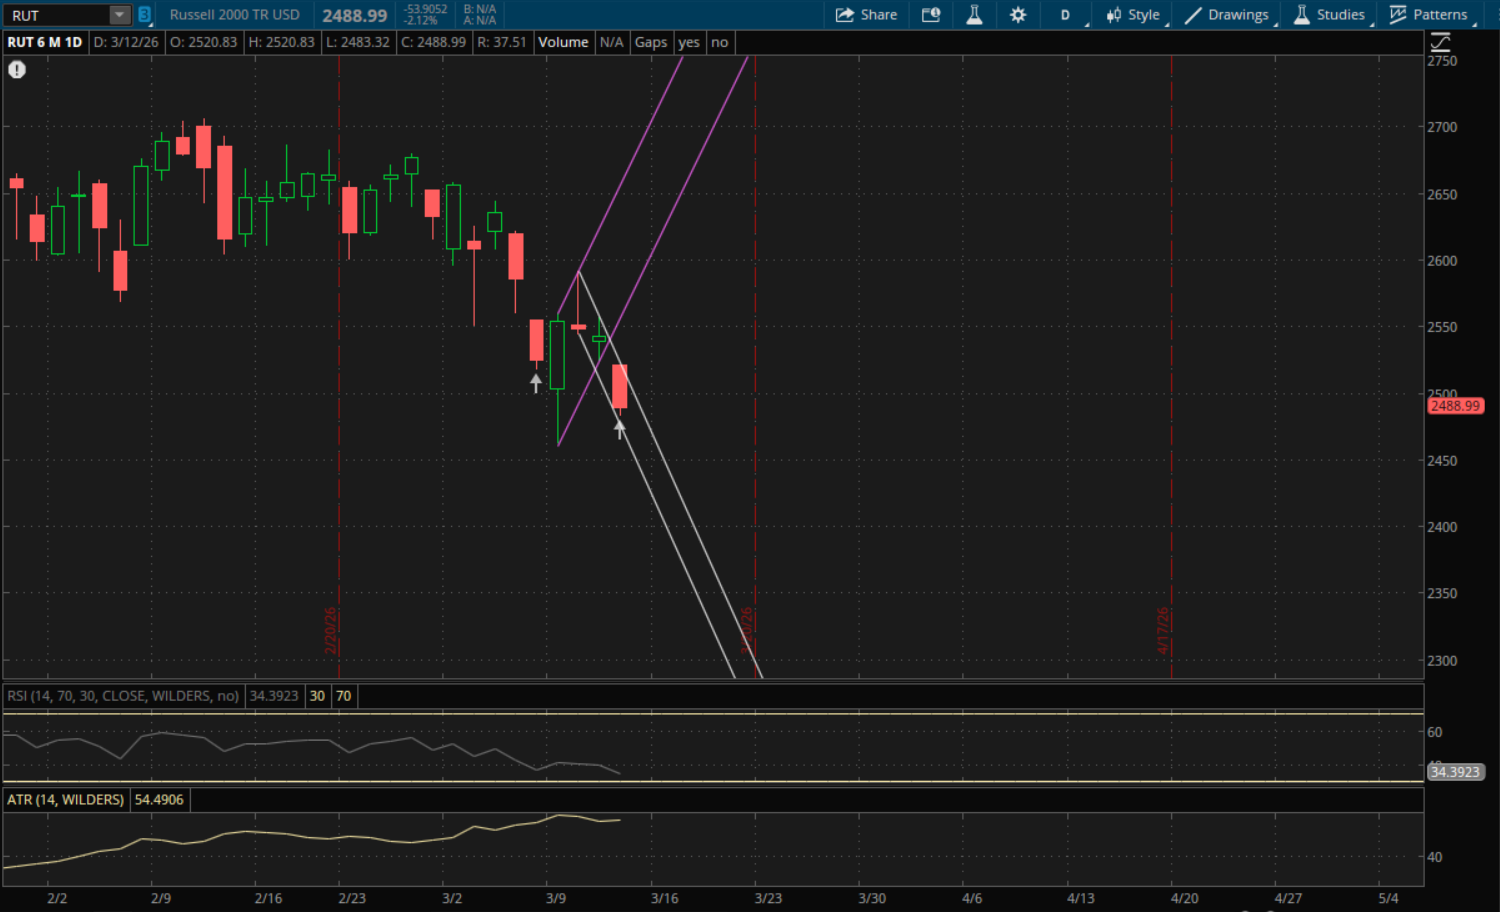
The Russell 2000 also opened below its prior uptrend and closed well below it, starting a new downtrend. This new downtrend (white) will be support/resistance at about 2,486 tomorrow which is actually just below today's close of 2,488.99. So it is possible it opens above it tomorrow, but it's essentially a toss up a this point. If it does open above it then that level will act as support on a retest and vice versa if it opens below it. If it opens above it and we get a rally going tomorrow, the only resistance level to watch for now will be from its prior uptrend (purple) at about 2,590. On the other hand if it does gap below the new downtrend (white) at 2,486 tomorrow or just breaks through it, then the next support to watch will be from the bottom end of this new downtrend at about 2,440.