The markets fell again on Friday with tech leading the way lower this time as the Nasdaq closed down 0.93%. Small caps outperformed after PCE data was in-line with expectations, but the Russell 2000 still closed lower by 0.36%. And the S&P fell another 0.61%. The VIX however was unchanged despite the continued pullback in markets. Oil meanwhile rallied again and is just under $100/barrel as there has been no de-escalation in the Middle East.
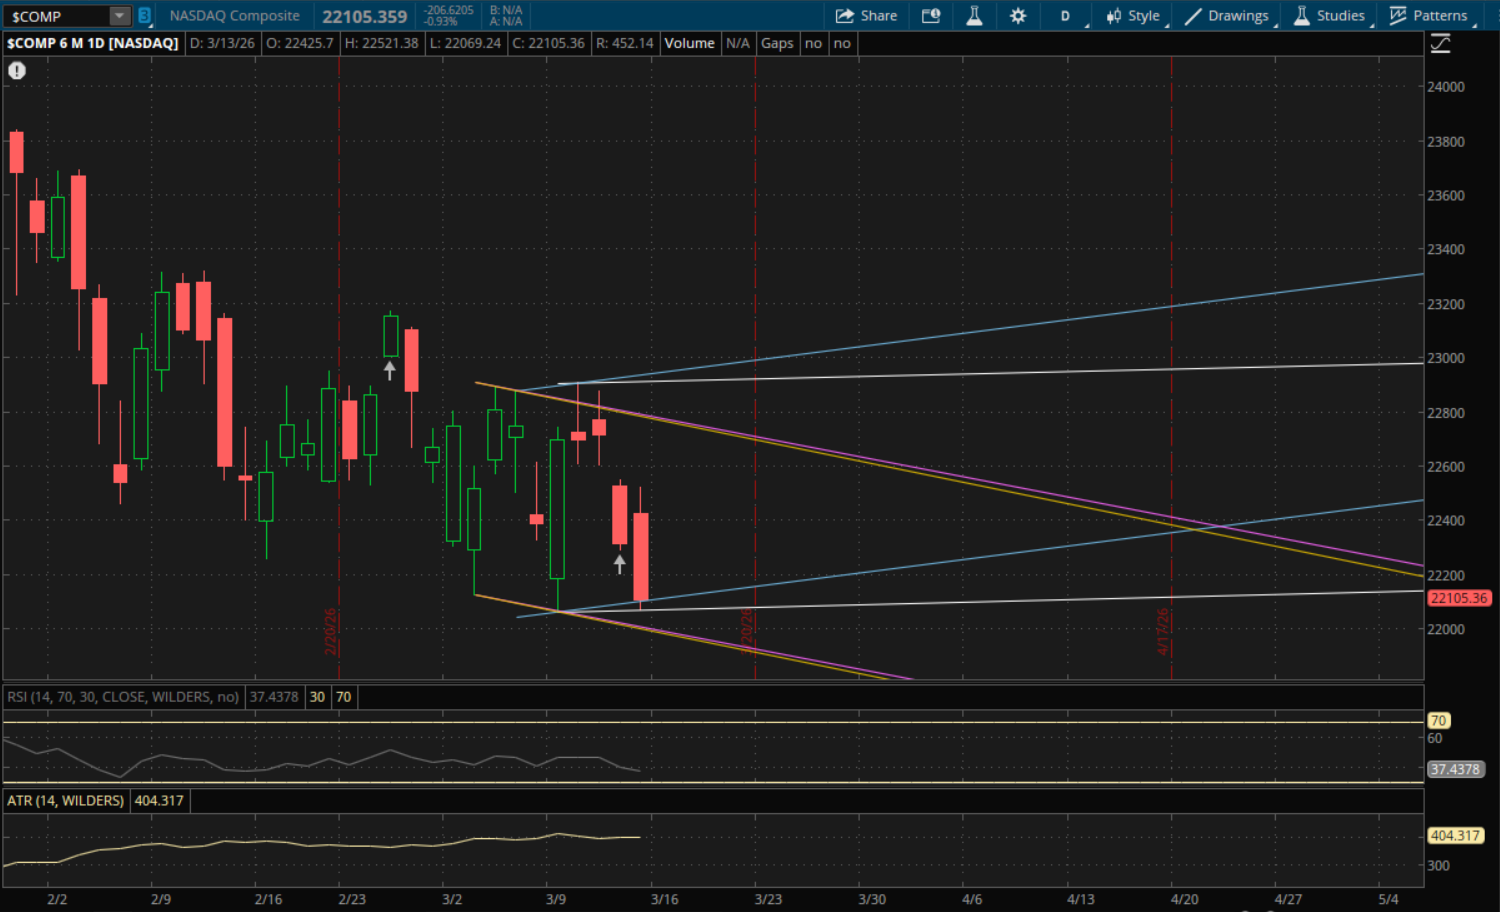
Tuesday's failed breakout for the Nasdaq was completed yesterday as it got back down to its new primary uptrend support that I mentioned in the prior update which was right around 22,100. It broke below this support but did close just above it at 22,105. Technically it's a failed breakdown since it did manage to get a little bounce back to close back over it, however it was a very weak finish near the lows of the day. Regardless, it still starts a new slight uptrend (essentially a sideways range). But due to the weak finish, it could easily gap below this new range on Monday.
The first level to watch on Monday will be from the prior uptrend (now blue) that it closed just above yesterday. This level will be at about 22,115 which is just above where it finished yesterday (22,105). So at the very least it will need a small gap up to open above this level which is the retest of yesterday's failed breakdown. If it fails to gap up on Monday, then that level will be resistance on a bounce. Its new, primary range (white), will be support at 22,070-22,075 which it could also gap below on Monday as it's not far away. If there is a gap beneath that level then it will also be resistance on a bounce. Its next two supports are from the prior downtrends (purple and yellow) which will be at 21,980-21,990.
If we get a rally going on Monday then the next resistance levels to watch will also be from those same prior downtrends (purple and yellow) at 22,765-22,775 followed by its new range (white) at 22,910 and lastly its prior uptrend (blue) at 22,925. These levels are pretty far away but they are within reach given the current volatility in markets.
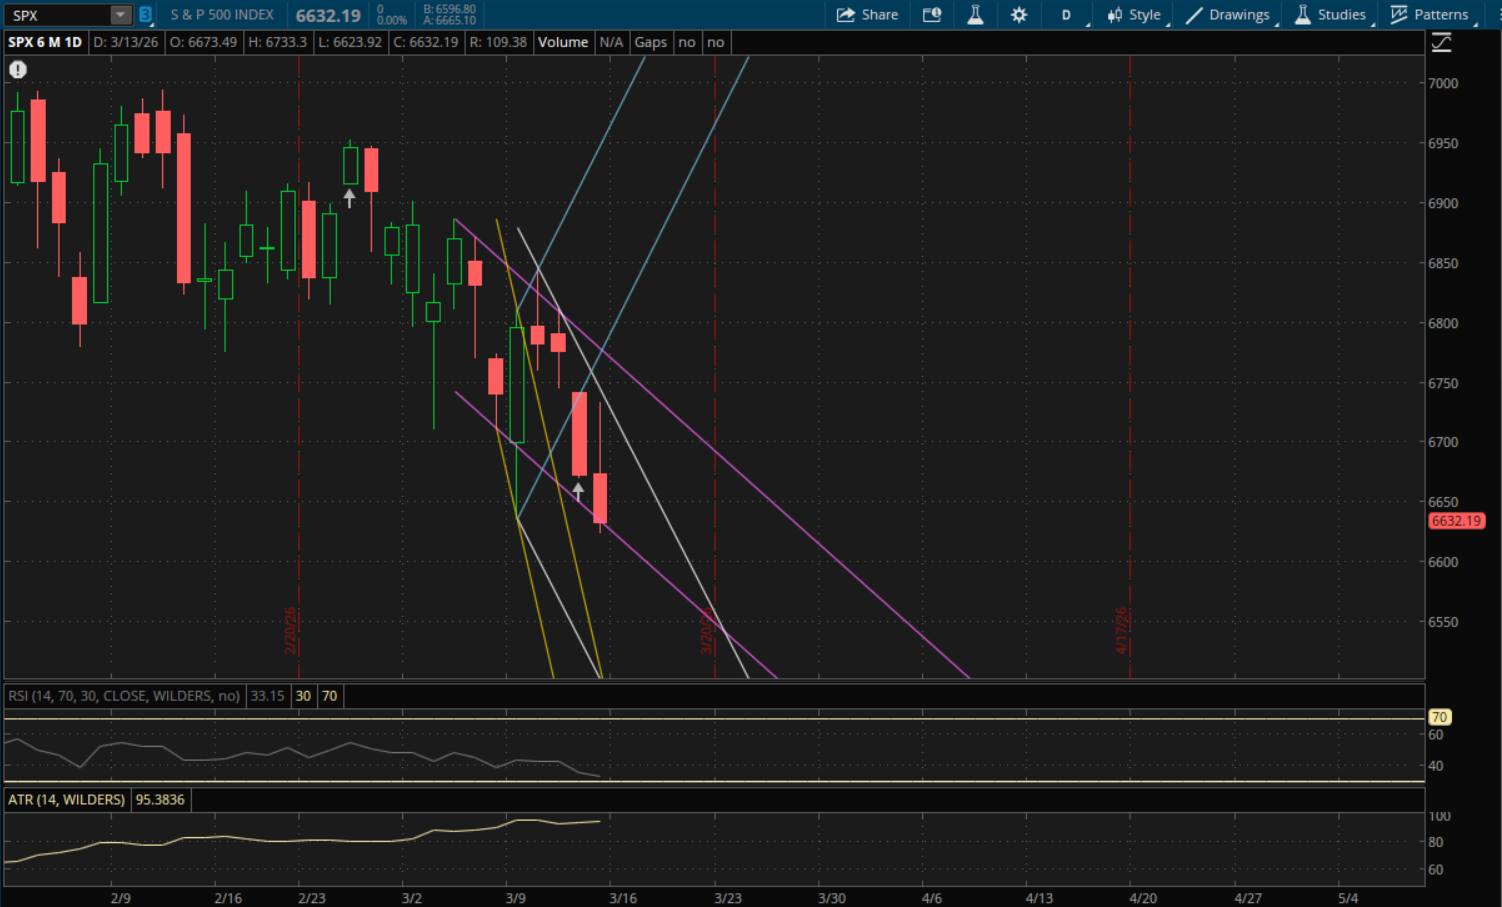
The S&P did not break through its primary downtrend from the prior update so it doesn't start any new daily trends going into Monday's session. The markets did have an early rally attempt yesterday with the S&P nearly testing its primary downtrend (white) which is where I entered short yesterday and took profits on the way down. It also begin to break through its prior downtrend (purple) into the close but it was an insignificant break so this trend remains valid for now.
That downtrend (purple) will be the first level to watch on Monday which will be at about 6,618 which the S&P is above as of Friday's close at 6,632. If it opens above it, then it will remain as support and if it gaps below it then it will be resistance. That's really the only support to watch for now as its primary downtrend will be very far and it's unlikely it gets tested. On a bounce, the first resistance to watch will be from that primary downtrend (white) at about 6,708. If it can break through that then there would be more resistance from its prior downtrend (purple) again at 6,760.
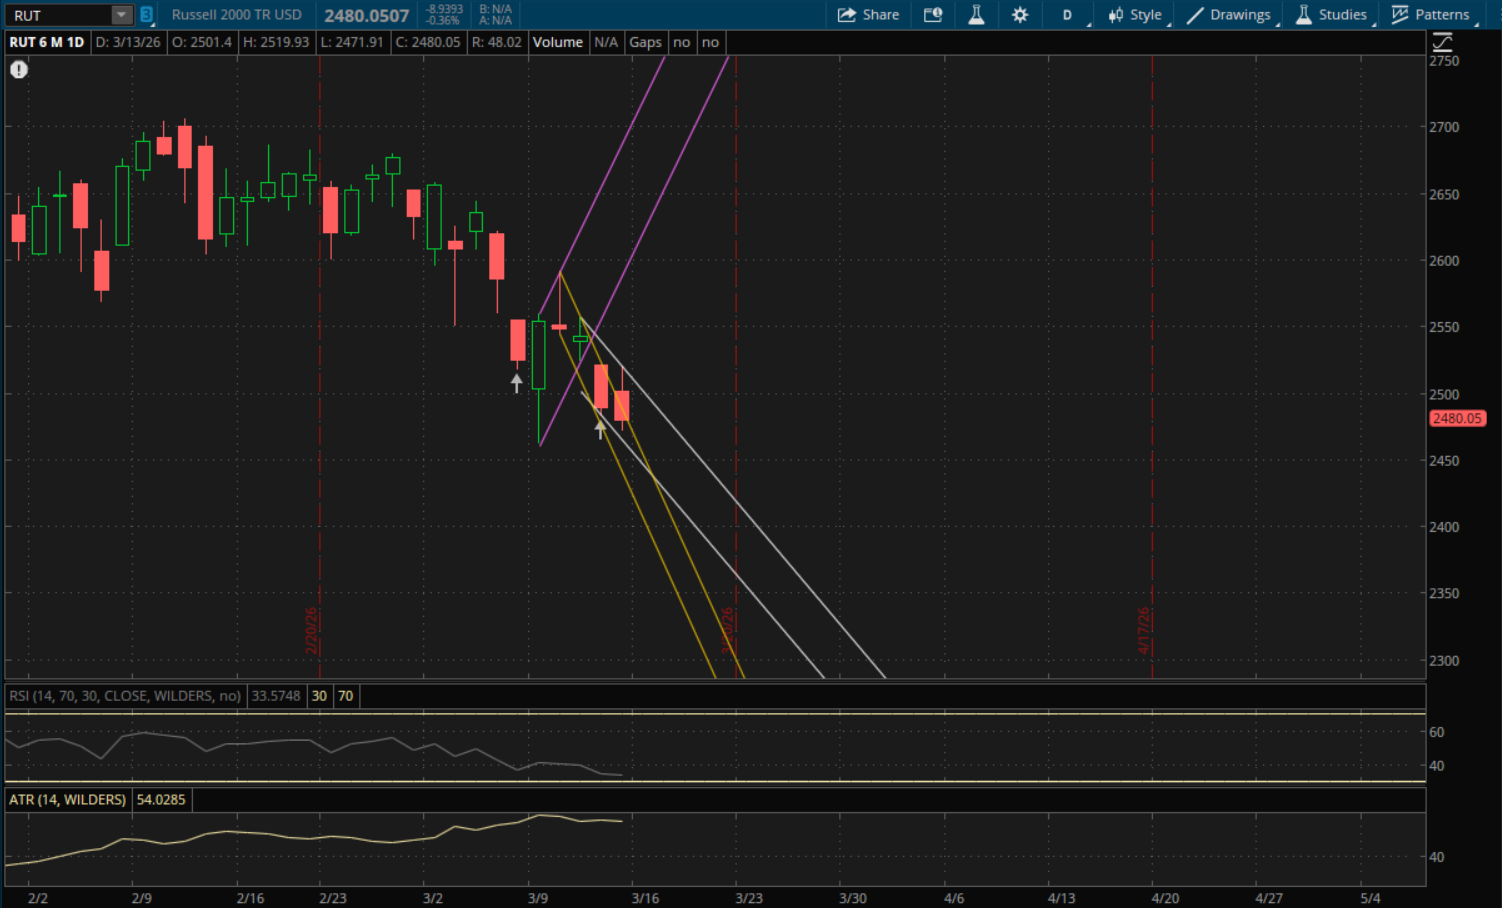
The Russell 2000 opened higher yesterday after the in-line PCE report calmed the inflation fears. It gapped above its previous primary downtrend (now yellow) from yesterday's update, however the rally faded and it closed back below that downtrend putting in a failed breakout which starts a new downtrend (white) for it going into Monday. Resistance from this new downtrend will be right around 2,500 for Monday. That's the only resistance level to watch for now, if it breaks through it then we'll need to see where it closes for the new trend.
If we get another sell-off then the next support level to watch will be from the prior downtrend that it failed to close above yesterday (yellow). This will now be support at about 2,452 on a pullback assuming it opens above it. After that, its new downtrend (white) would be support at about 2,446. If this doesn't hold, then its prior downtrend (yellow) comes into play again with the bottom end of that range being support at about 2,405.