Markets continued their declines this week with the S&P losing another 1.6% and posting its third straight weekly loss. It has now fallen 5.3% from its all time high set in late January. The Russell 2000 was the laggard again as it closed the week down another 1.8%. Meanwhile tech led most of the week which was helped by a rebound in software, but it also sold off into the end of the week and posted a weekly loss of 1.3%. Despite the continued weakness in markets, the VIX closed the week lower by 7.8% after briefly breaking above $35 which was its highest levels since last year's tariff sell-off.
All eyes will be on the Fed this week with the next interest rate decision coming this Wednesday, March 18th, at 2:00 PM Eastern. There are no surprises expected with odds virtually at 100% of no change in rates this week, and odds of the next rate cut have been pushed back to 2027 due to rising inflation. But, Fed Chair Jerome Powell's press conference at 2:30 PM Eastern will certainly be market moving as he provides insight into what the FOMC is thinking.
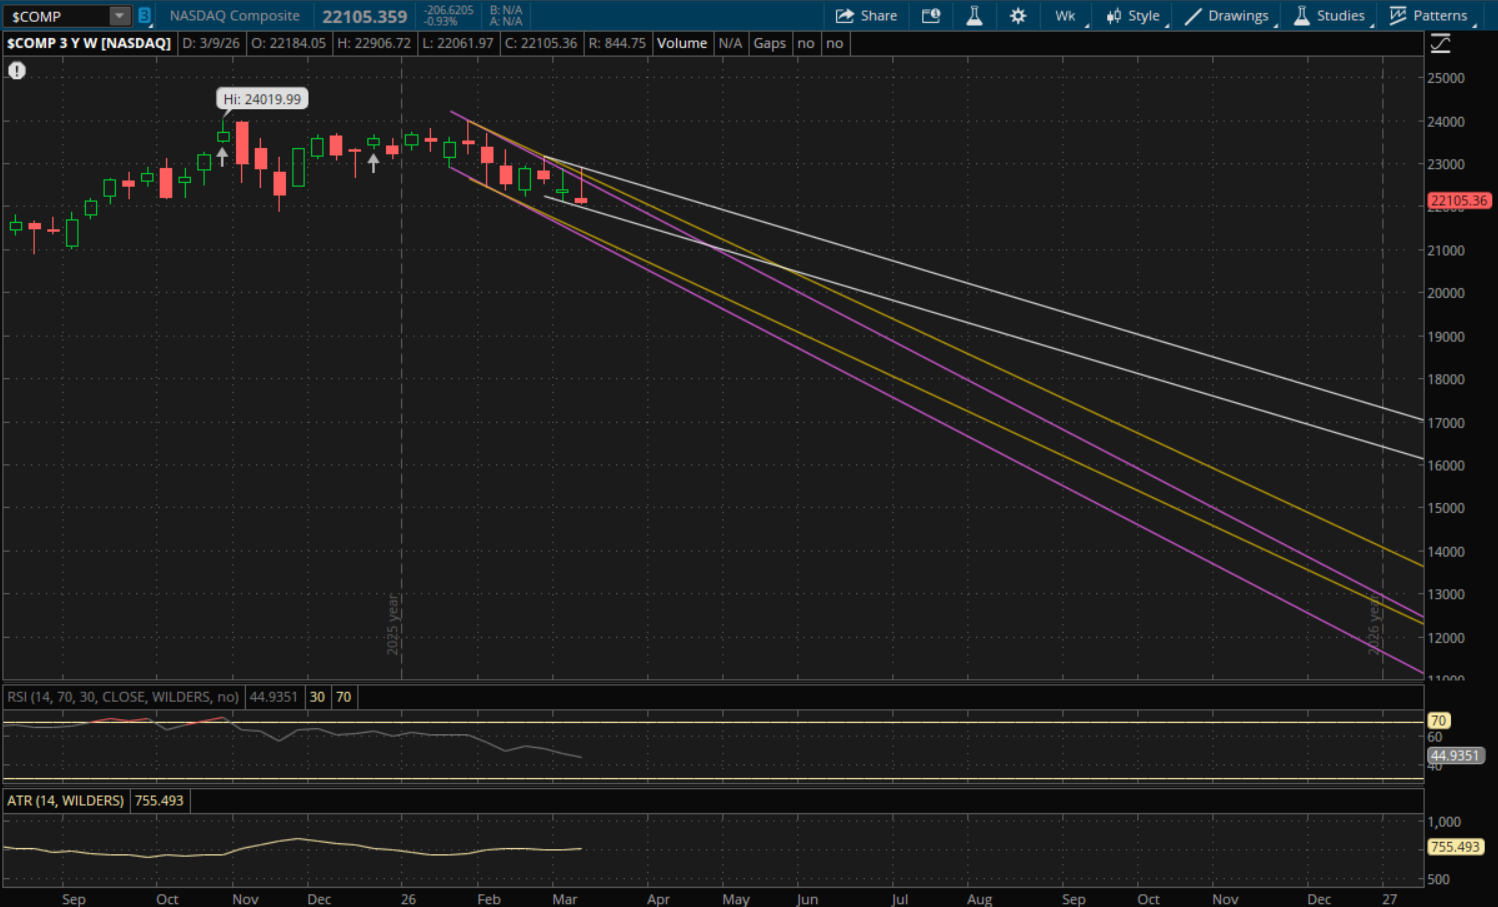
The Nasdaq was strong early in the week and it did begin to break through its weekly downtrend resistance from last weekend's update, however it sold off again into the end of the week and finished near the lows of the week giving it another failed breakout on the weekly time frame. This shows that sellers remain in control for now.
There is a silver lining here which is that its new primary downtrend (white) it started with the failed breakout this week is much narrower than prior downtrends and support from this new downtrend will be at about 21,860 next week which isn't that much further away (1.1%). If it were to break through this support, or even potentially gap below it on Monday if there's a big gap down, then the next support to watch will be from its prior downtrend (yellow) at 21,235. Its last weekly support would be from its next downtrend (purple) at about 21,100.
On a bounce, these prior downtrends (purple and yellow) will still be resistances to watch at about 22,400 and 22,550. If we get a rally going and it breaks through these levels, then its next resistance will be from its new primary downtrend (white) at about 22,775.
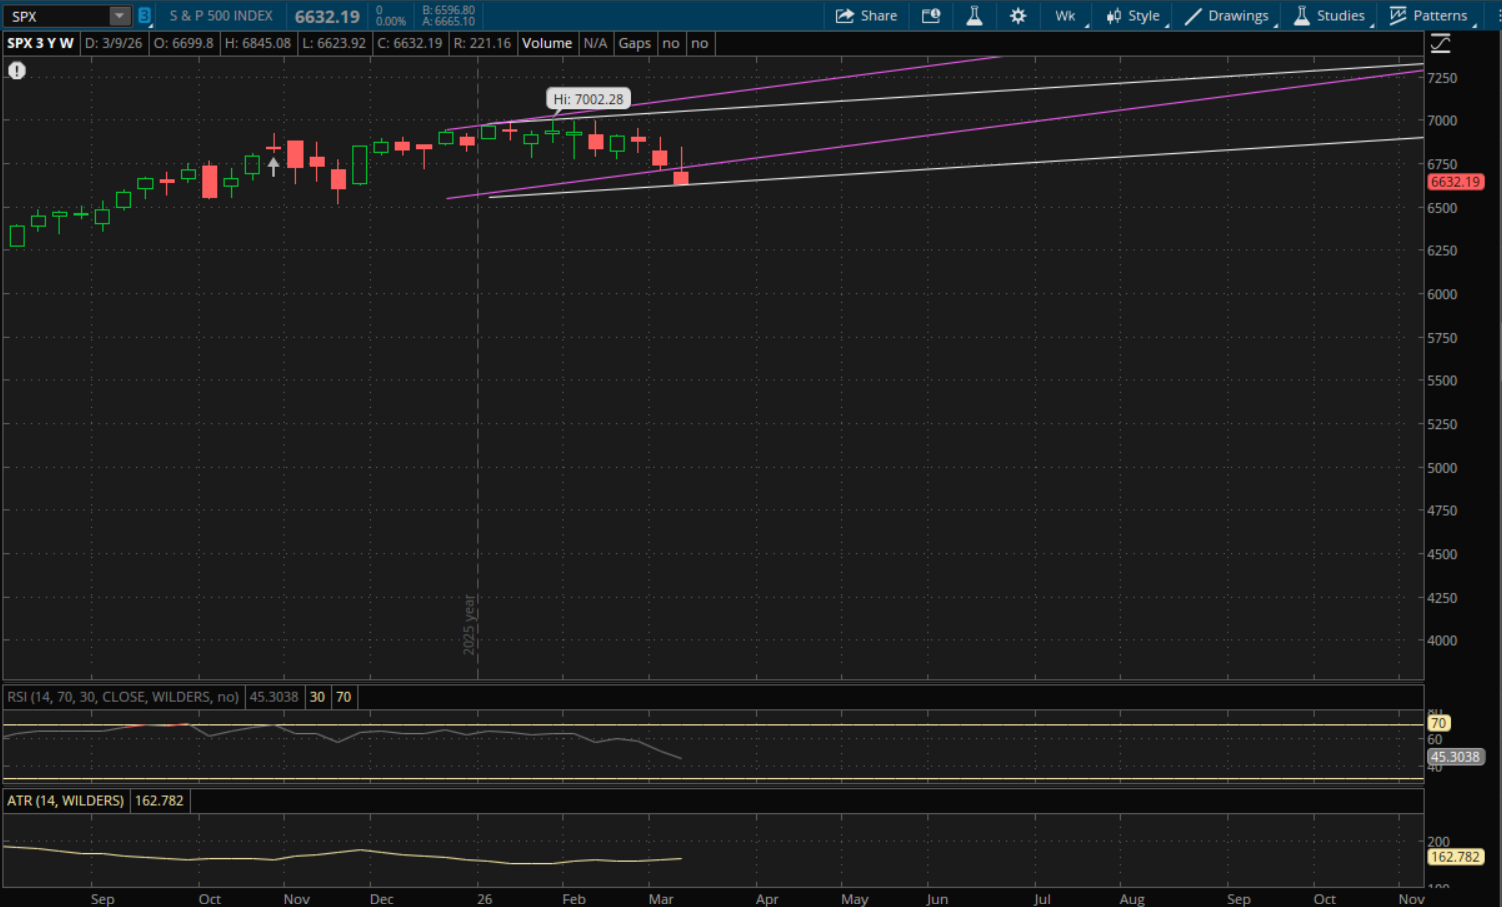
The S&P broke and closed below its prior uptrend support, but for now it still starts a new slight uptrend (essentially a sideways range). The problem is that it closed just off the lows of week yesterday and there's risk of a gap below this new trend (white) on Monday which will be support at 6,632-6,633. That's where it closed this week out at (6,632.19). So it needs to gap up on Monday for this level to remain as support. If it can, then the next level to watch on a bounce will be its prior uptrend (purple) at 6,743-6,744.
If the S&P fails to open higher on Monday, then that 6,632-6,633 area becomes resistance on a bounce attempt. We'll have to see where it closes the week for the next trend as these are the only valid trends for it right now.
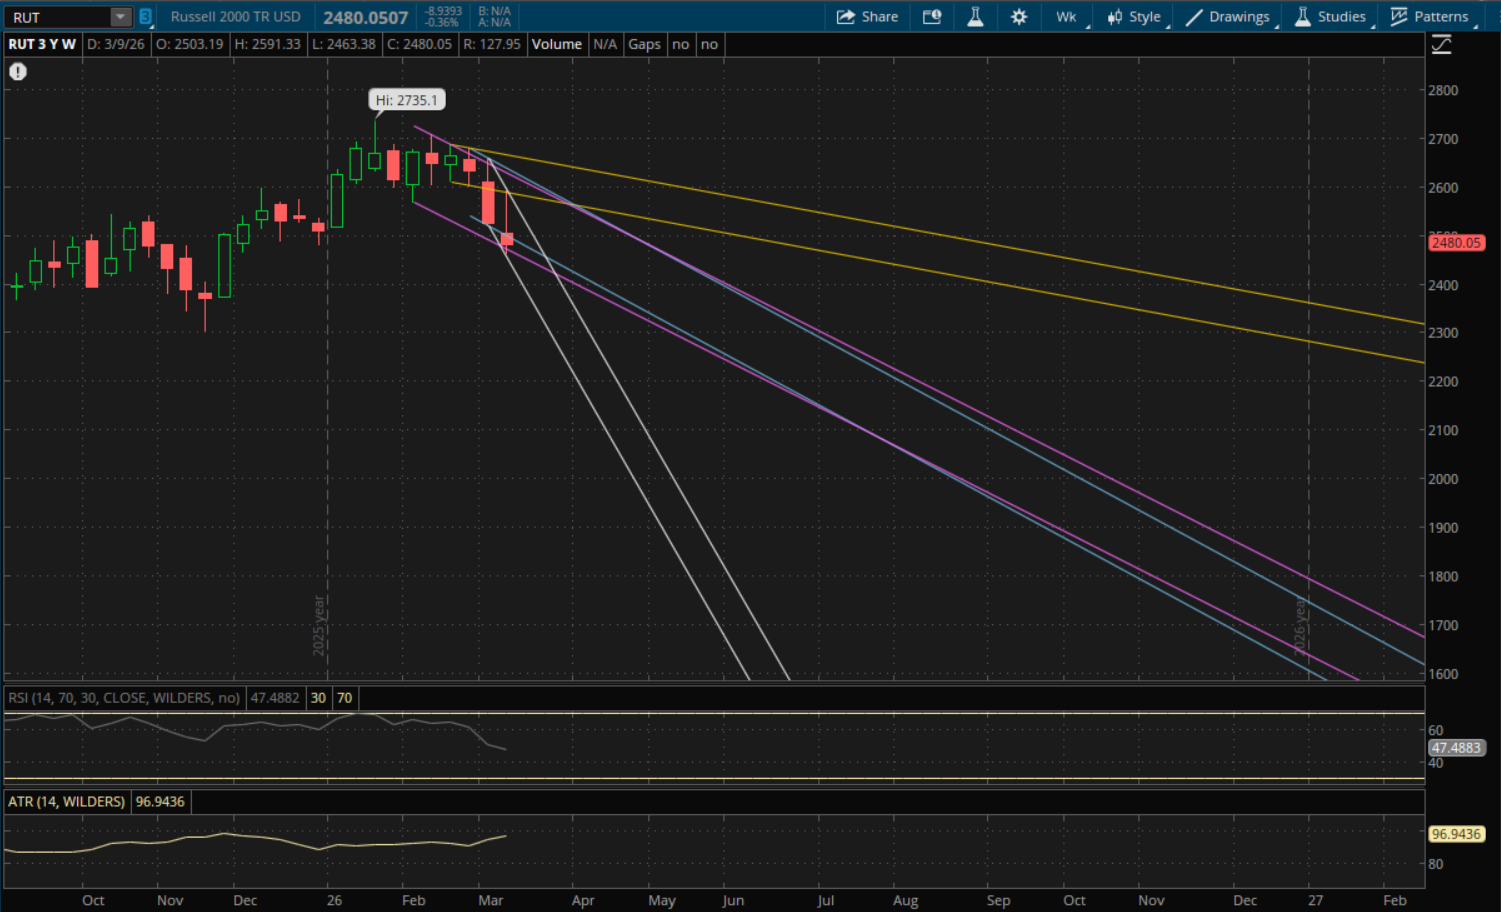
The Russell 2000 also broke and closed below its prior downtrend which starts a new downtrend for it going into next week. Its prior trends remain valid so there are several levels to watch for next week. The first is its prior downtrend (blue) which will be at about 2,476 which it's just above now (2,480). If it opens above this level on Monday then it will act as support and its next resistance level to watch on a rally would be from its new primary downtrend (white) at 2,522. If it breaks through the primary downtrend, then its prior downtrend (yellow) would be the next resistance level at 2,580 followed by its prior downtrends (purple and blue) at 2,608 and 2,616. Lastly its prior downtrend (yellow) would be in play again at the top of the range at 2,658 if we were to get a big rally next week.
If it fails to open above that first support (blue) at 2,476 on Monday, or if it simply breaks below it, then its prior downtrend (purple) would be the next support to watch at 2,451. After that, its last support will be from its new primary downtrend (white) at 2,382.