On Friday morning we got the May jobs report which came in much stronger than expected as there were 172,000 jobs added vs the estimate of +85,000 while the unemployment rate remained unchanged at 4.3%. With the strong jobs data, the 10 year treasury yield spiked back over 4.5% as a stronger labor market gives the Fed room to hike rakes in order to fight inflation. The U.S. Dollar also jumped on the strong jobs data, providing an additional headwind for risk-on assets.
In addition to rising yields, and the rising dollar, some air had to come out of the market as it has been pretty parabolic over the last two months. This happened on Friday with tech getting hit the hardest as it closed down 4.18% near the lows of the day. This was its biggest one day drop since April of 2025 during the global tariff sell-off. The Russell 2000 lost 3.5% after it had hit new all time highs on Thursday. Meanwhile the S&P, which was the best performing index, closed down 2.6% for the day. With the sharp sell off in markets, the VIX came to life and at market close it was up 31%. But, markets continued lower after the close and the VIX settled up 39.7% for the session (VIX settles 15 minutes after market close). While this was a really ugly finish for markets, typically when there are these massive one day spikes in the VIX it signals capitulation and these are typically very short term market sell-offs rather than something prolonged.
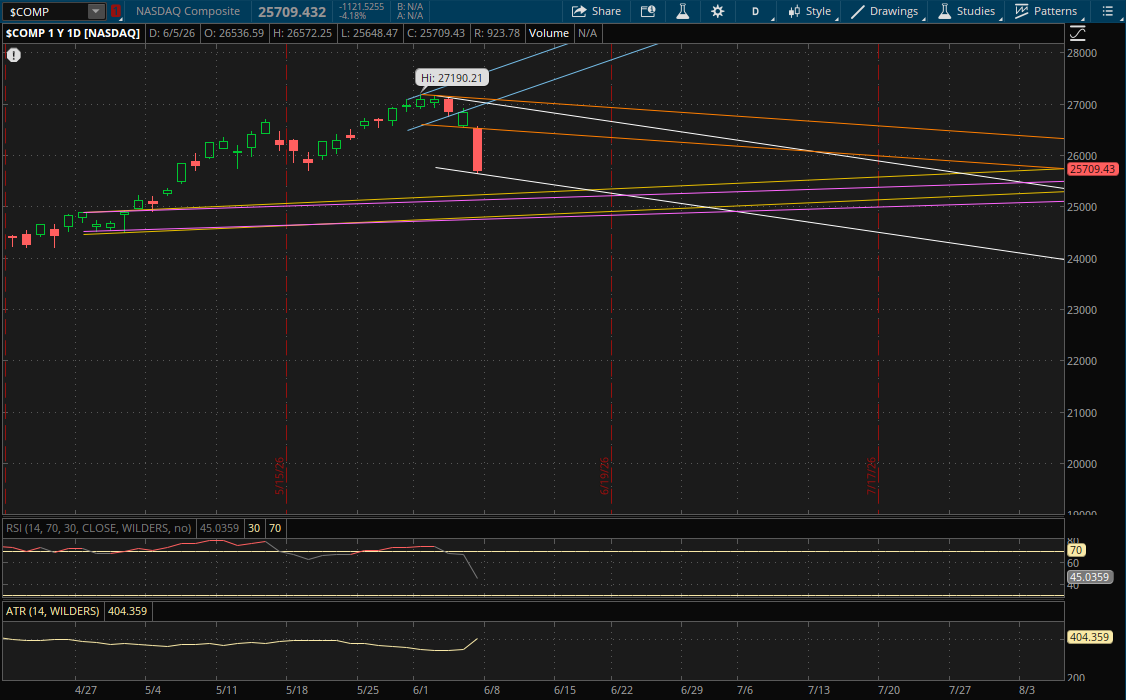
The Nasdaq gapped below its last primary downtrend support that it started on Thursday and closed well under it. This started another downtrend for it going into Monday's session, but it's already at the bottom of this new primary range (white) which will be the first support level to watch just above 25,600. It finished at 25,709 on Friday, so as long as it doesn't gap below the 25,600 level tomorrow, that area will be the first support on a continued pullback. On a bounce back tomorrow, the only resistance that would potentially be in play is from its prior downtrend (orange) that it closed below on Friday. This will be around 26,500 which is about 3% away.
If the Nasdaq does gap or break below its primary downtrend support around 25,600, then the next support to watch will be from its prior uptrends at about 25,250 (yellow) and 25,150 (purple). These are prior trends from late April that never got invalidated and will still be valid supports if this sell-off continues.
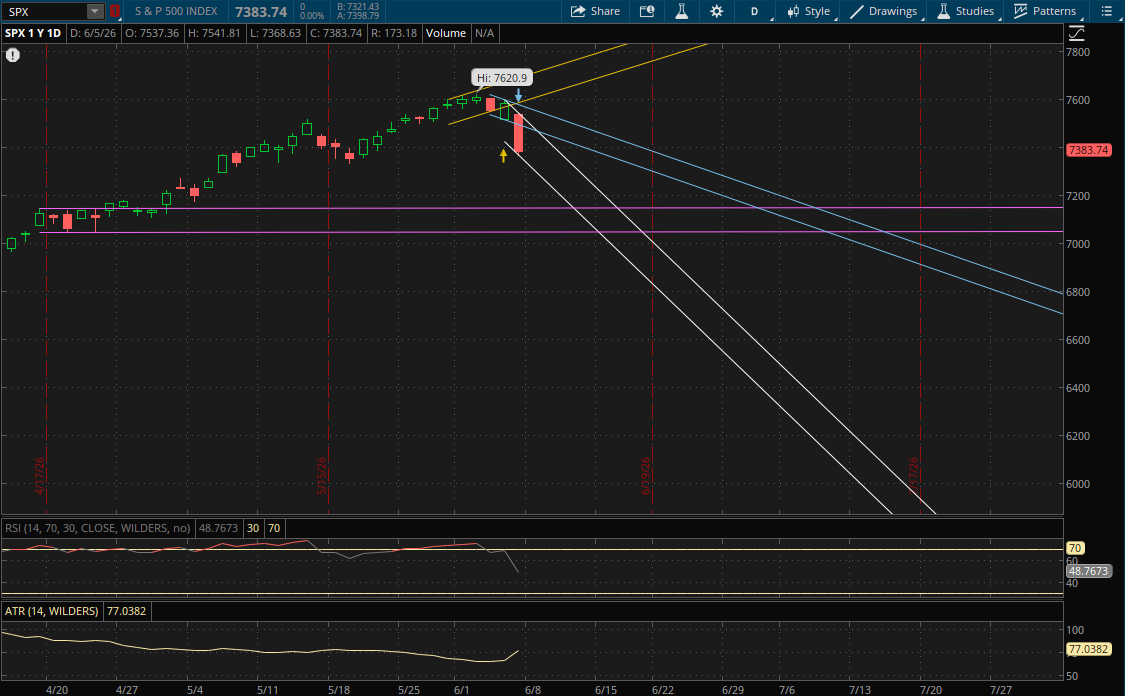
The S&P also broke and closed below its last primary downtrend support, starting a new daily downtrend for it. It is also already the bottom of this new primary range (white) which will be the first support to watch tomorrow at about 7,310. Now the S&P closed at 7,383 on Friday, so it would need to see a big gap down tomorrow to open below the new primary downtrend support. Odds are this doesn't happen, and it will be support on another pullback instead. On a bounce, the first resistance to watch will be from its prior downtrend (blue) at 7,475 and then its primary downtrend comes back into play (from the top of the range) at about 7,485.
On the off chance the S&P does get a big gap below its primary downtrend at 7,310, or if it simply breaks through it on a continued sell-off, then the last daily support likely in play for tomorrow would be at 7,150 from its prior sideways range (purple).
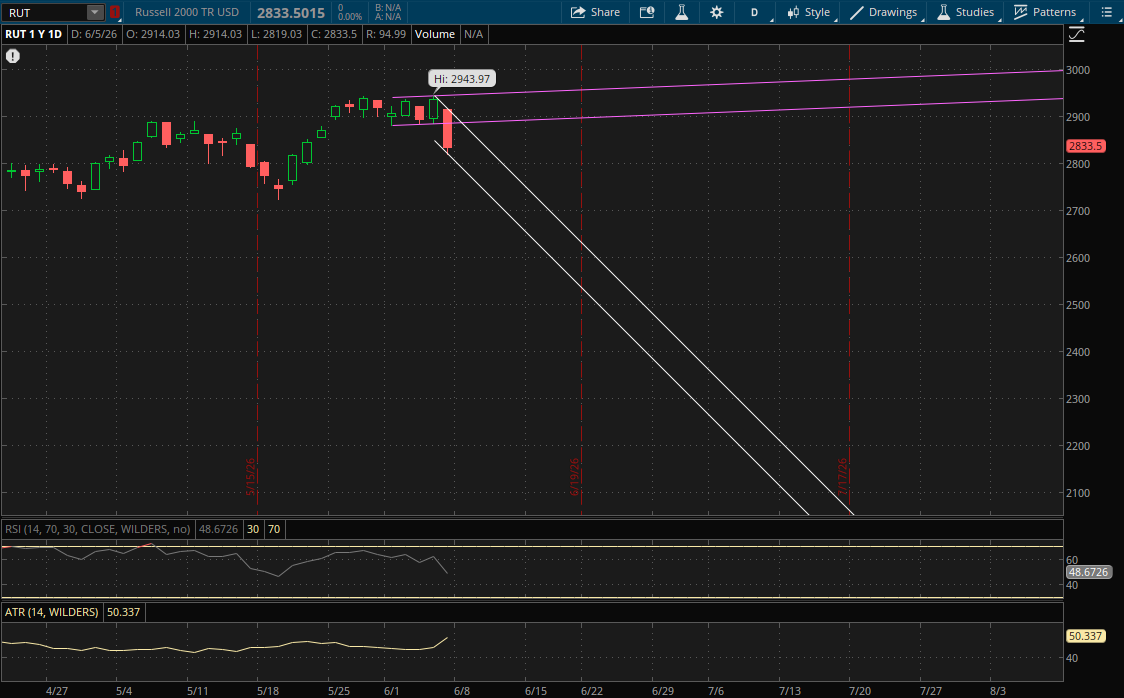
Similar to the S&P and Nasdaq, the Russell 2000 also broke and closed well below its prior daily downtrend support, starting a new primary downtrend (white) and it's at the bottom of this range already. This will be the first support to watch for tomorrow at 2,788 on a continued pullback. The Russell closed at 2,833, so it will likely open above it. On a bounce, the first resistance to watch will also be from this new primary downtrend (top of the range) at 2,883 followed by its prior uptrend (purple) at about 2,887.
If there is a big gap down below the primary downtrend at 2,788 then that level becomes resistance on a rally attempt. If it opens above it, but breaks through it on a continued sell-off then we'll have to wait to see how it closes for the next range as there are currently no other valid trends below it.