The markets finally pulled back this week with a massive sell-off on Friday to snap the S&P and Nasdaq's 9 week long winning streak. The Nasdaq was the biggest loser for the week, closing down 4.7% while the Russel 2000 and S&P lost 2.9% and 2.6%, respectively. The VIX on the other jumped 40% for the week after it had been nearing its 2026 lows. For this week, the biggest economic data point will be Wednesday's CPI print as it will give us another look at the current inflation situation and it will move yields which was part of the reason for Friday's big sell-off in the markets.
In my last few market updates I had been warning of a market pullback as there was more and more overhead resistance building and the continuous gap ups in the market were getting less and less likely to continue occurring. In fact, the Nasdaq and the S&P both got rejected almost perfectly off of their first monthly resistance levels (see the June monthly update).
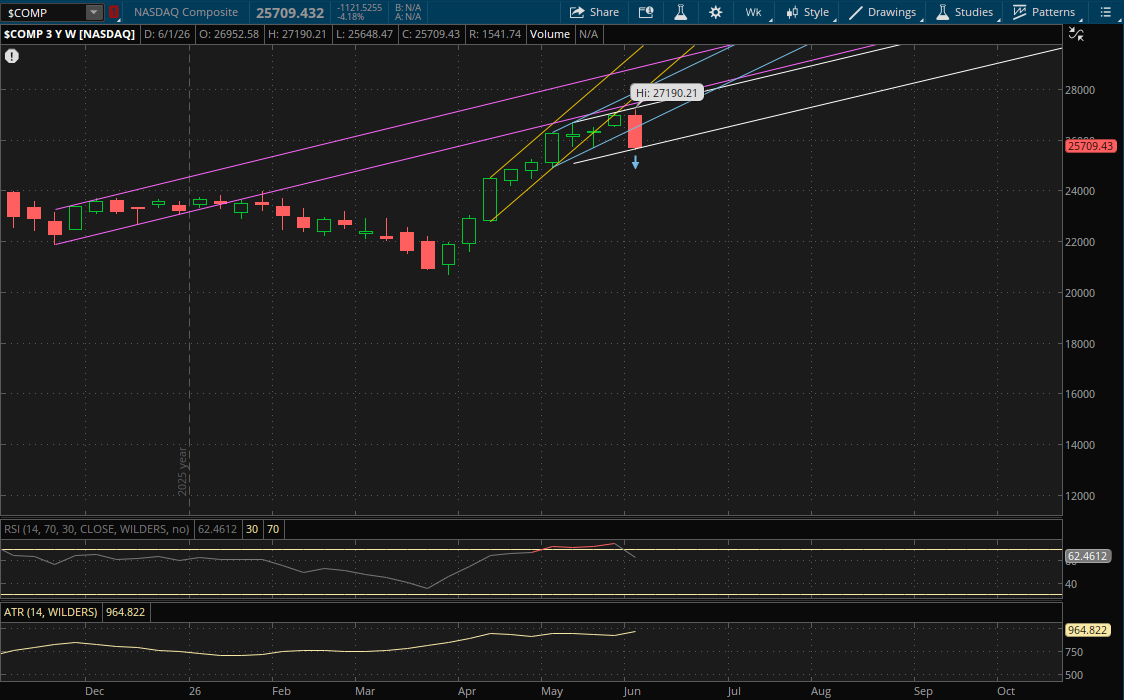
With last week's pullback, the Nasdaq did break and close well below its prior uptrend support. However, it did still start a new weekly uptrend. The risk is now how it opens tomorrow morning as its new primary uptrend (white) will be at about 25,850 for this week. That is above Friday's close of 25,709. So the Nasdaq needs to gap up tomorrow back over the 25,850 level in order for that to remain as support. That's only about a 0.5% gap up which isn't a lot considering Friday's big sell-off of over 4%. If it can get this gap up above 25,850 then that level will remain as support on a pullback. On a rally this week, the first weekly resistance to watch will be right around 26,900 from its prior uptrend (blue) that it closed below last week. If it can break back above this level, then its primary uptrend (white - top of the range) would likely be the last potential resistance tested around 27,500 which would also be new all time highs for it.
Now if the Nasdaq fails to get the gap back over its primary uptrend support around 25,850 tomorrow, then that level will be resistance on a rally attempt. If it opens above it, but breaks through it on a continued sell-off, then we will have to wait and see how it finishes for the next trend to develop as there are currently no other trends below it to act as support.
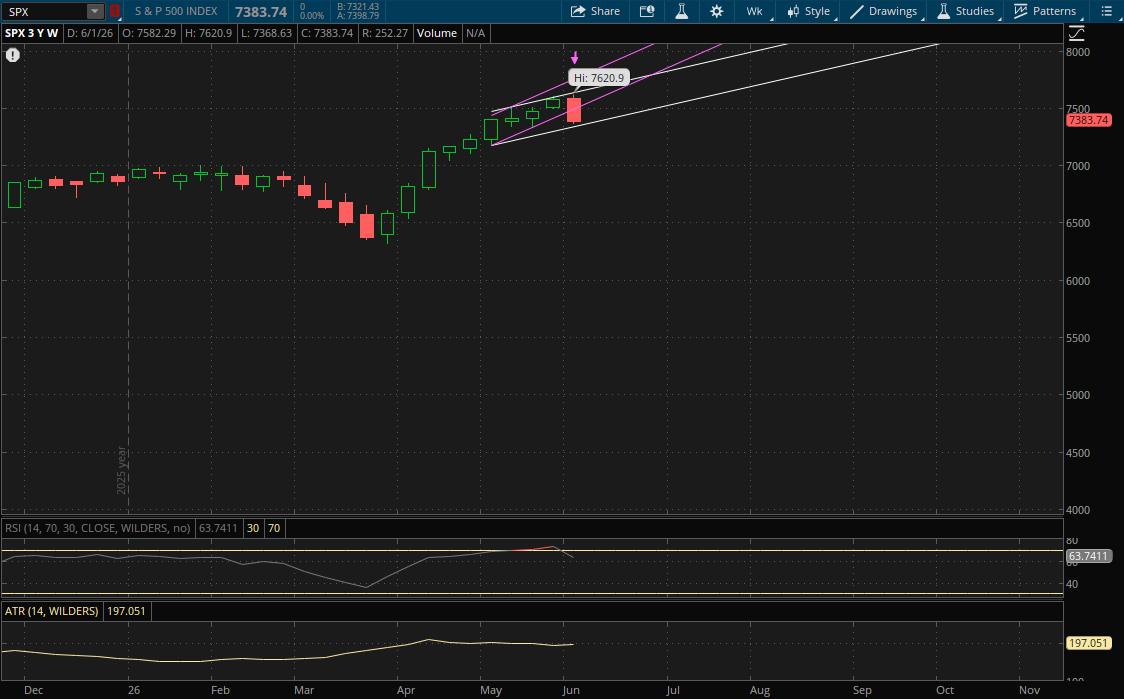
The S&P also broke and closed below its prior weekly uptrend, but it also started a new weekly uptrend for this week. Its new primary uptrend (white) will be at about 7,380-7,382 which is just below last week's close of 7,383.74. So it doesn't need to gap up tomorrow, but it would be ideal for the bulls. A flat open right around that support would give it better odds of breaking through it. But as long as it does open above this 7,380-7,382 level tomorrow it will act as support on a pullback. On a rally, the first resistance to watch will be at about 7,575 from its prior uptrend (purple) that it closed below last week. If it breaks through it, the last resistance to watch would be from its primary uptrend (white - top of the range) at 7,680-7,685.
If the S&P does fail to open above its new primary uptrend support at 7,380-7,382 tomorrow then that will become resistance on a rally attempt. If it opens above it, but breaks through it, we'll have to wait to see how it closes because just like the Nasdaq, there are no other weekly trends below it right now. It would start a new trend going into the following week, but first we have to see how it finishes.
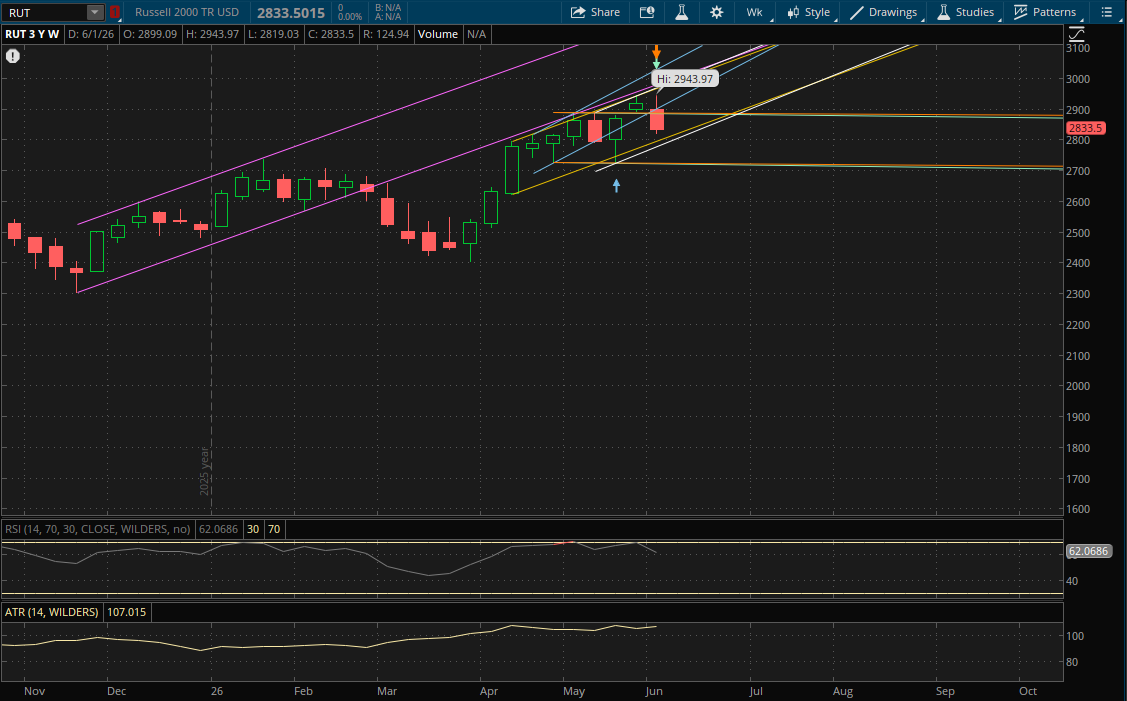
Similar to the S&P and Nasdaq, the Russell 2000 broke and closed below its prior weekly uptrend support, but still starts a new uptrend going into this week. It also has several other prior ranges that remain valid for now and will continue to act as support and resistance. The first resistance on a bounce back will be from its prior sideways ranges (green and orange) at 2,885-2,890. If it breaks through these two ranges, the last resistance likely in play for this week will be its prior uptrend (blue) at 2,937-2,938.
The first support to watch for this week will be from its prior uptrend (yellow) at about 2,822 which is below last week's close of 2,833. As long as it doesn't gap below it, that level will be the first support to watch on a pullback. If it doesn't hold, then its new primary uptrend (white) will be the next support at about 2,805. If it gaps or breaks below this, then the last supports in play for this week would again be its prior sideways ranges (orange and green - from the bottom of the ranges) at 2,720-2,725.